Introduction
What is Report Assistant?
Report Assistant is an advanced AI tool designed to support reading physicians in creating, refining, and managing medical imaging reports. It enhances workflow efficiency and ensures high-quality report content while preserving physician oversight.
Core Purpose:To assist, not replace, the reading physician in: | |
|---|---|
Current Release - Release 3.0 | Generating specific sections of the report such as Impression and Recommendations. |
Future Release - Release 3.1 | Report corrector and prompt insertion. |
Future Release - Release 3.2 | Provide clinical guidance for breast reporting. |
Future Release - Release 3.3 | Personalizing reports to match the physician's individual style and preference. Supporting clear, professional, and accurate reporting. |
Report Assistant 3.0 Sub-Agents | |
|---|---|
Report Impression 1.0 | |
Report Recommendation 1.0 | |
All outputs are reviewable suggestions — the reading physician retains full control. |
When to Use It |
|---|
After completing the Findings section. |
To help generate clear summary sections. |
What It Is Not |
|---|
Not a diagnostic tool — it does not analyze images. |
Not a full report generator. |
Not autonomous — all outputs require physician review. |
Not a replacement for the reading physician’s judgment and editing. |
User Guide
Report Impression 1.0
Gap | Reading physicians can face inconsistency and variability in impression statements due to time constraints, fatigue, or differences in dictation style. |
|---|---|
Solution | The Impression Agent converts report findings into consistent, concise, and clinically accurate list of impression statements. |
User Flow:
Login and access the radiology report. | |
|---|---|
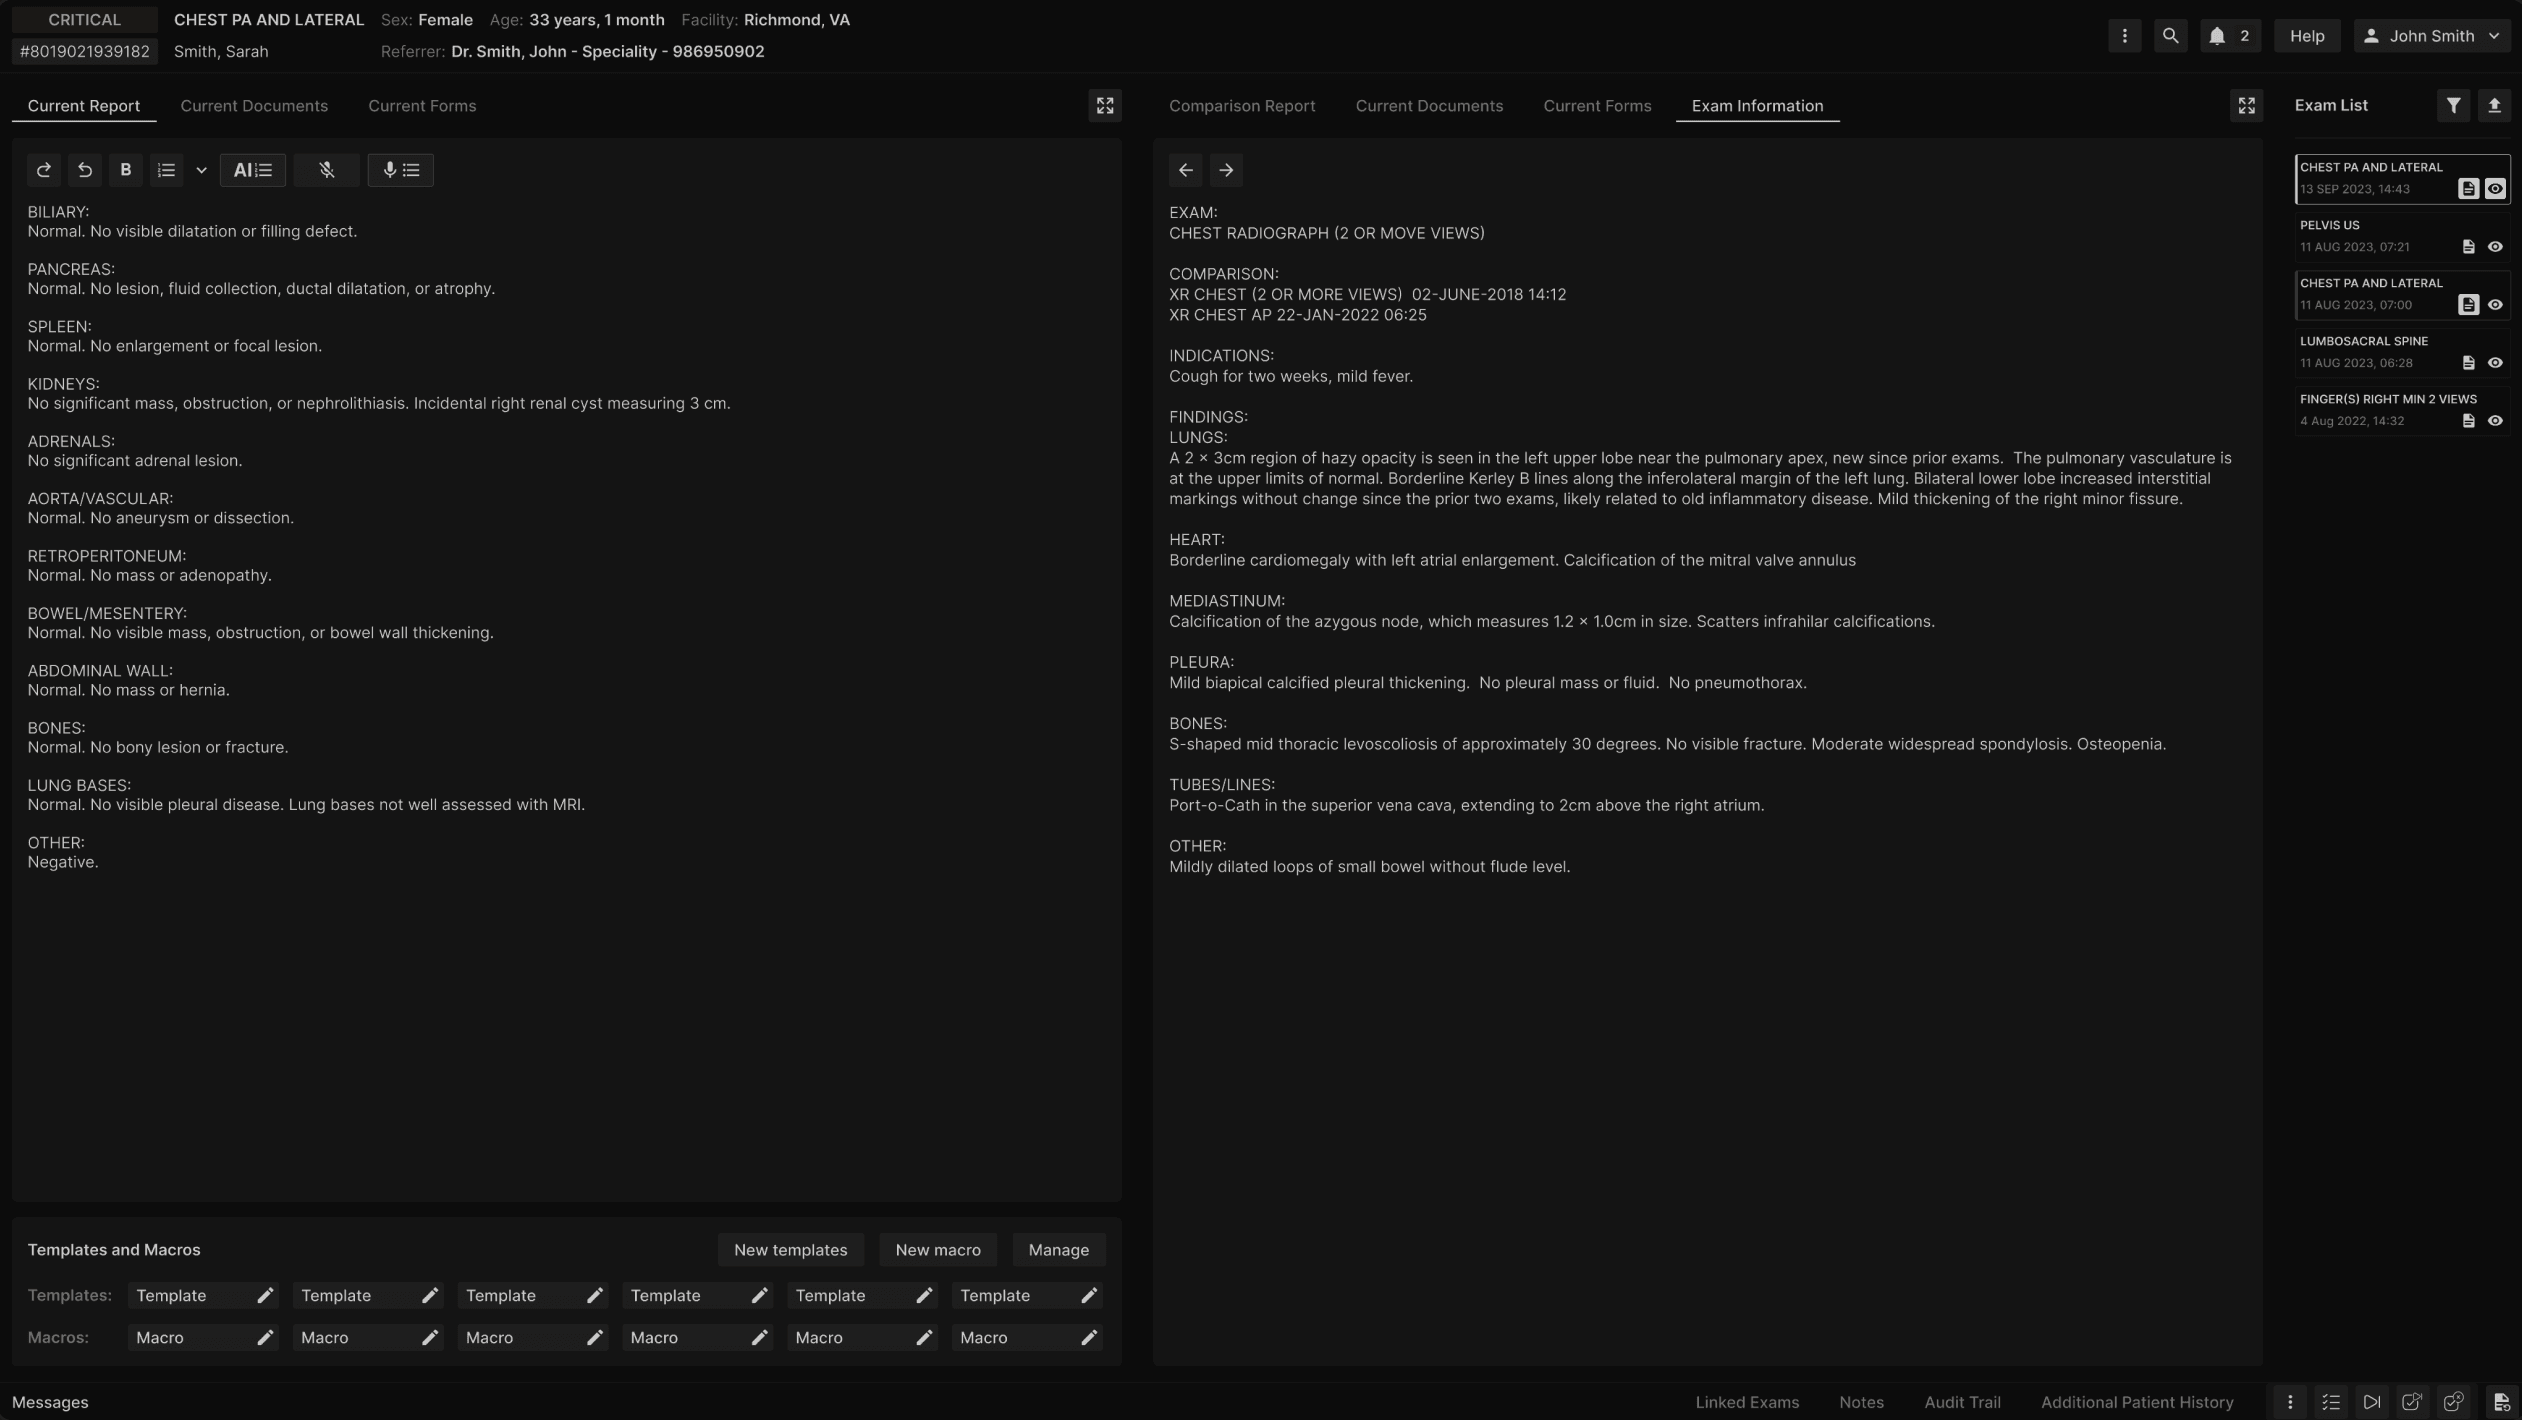 |
Select the "Impress" button. | |
|---|---|
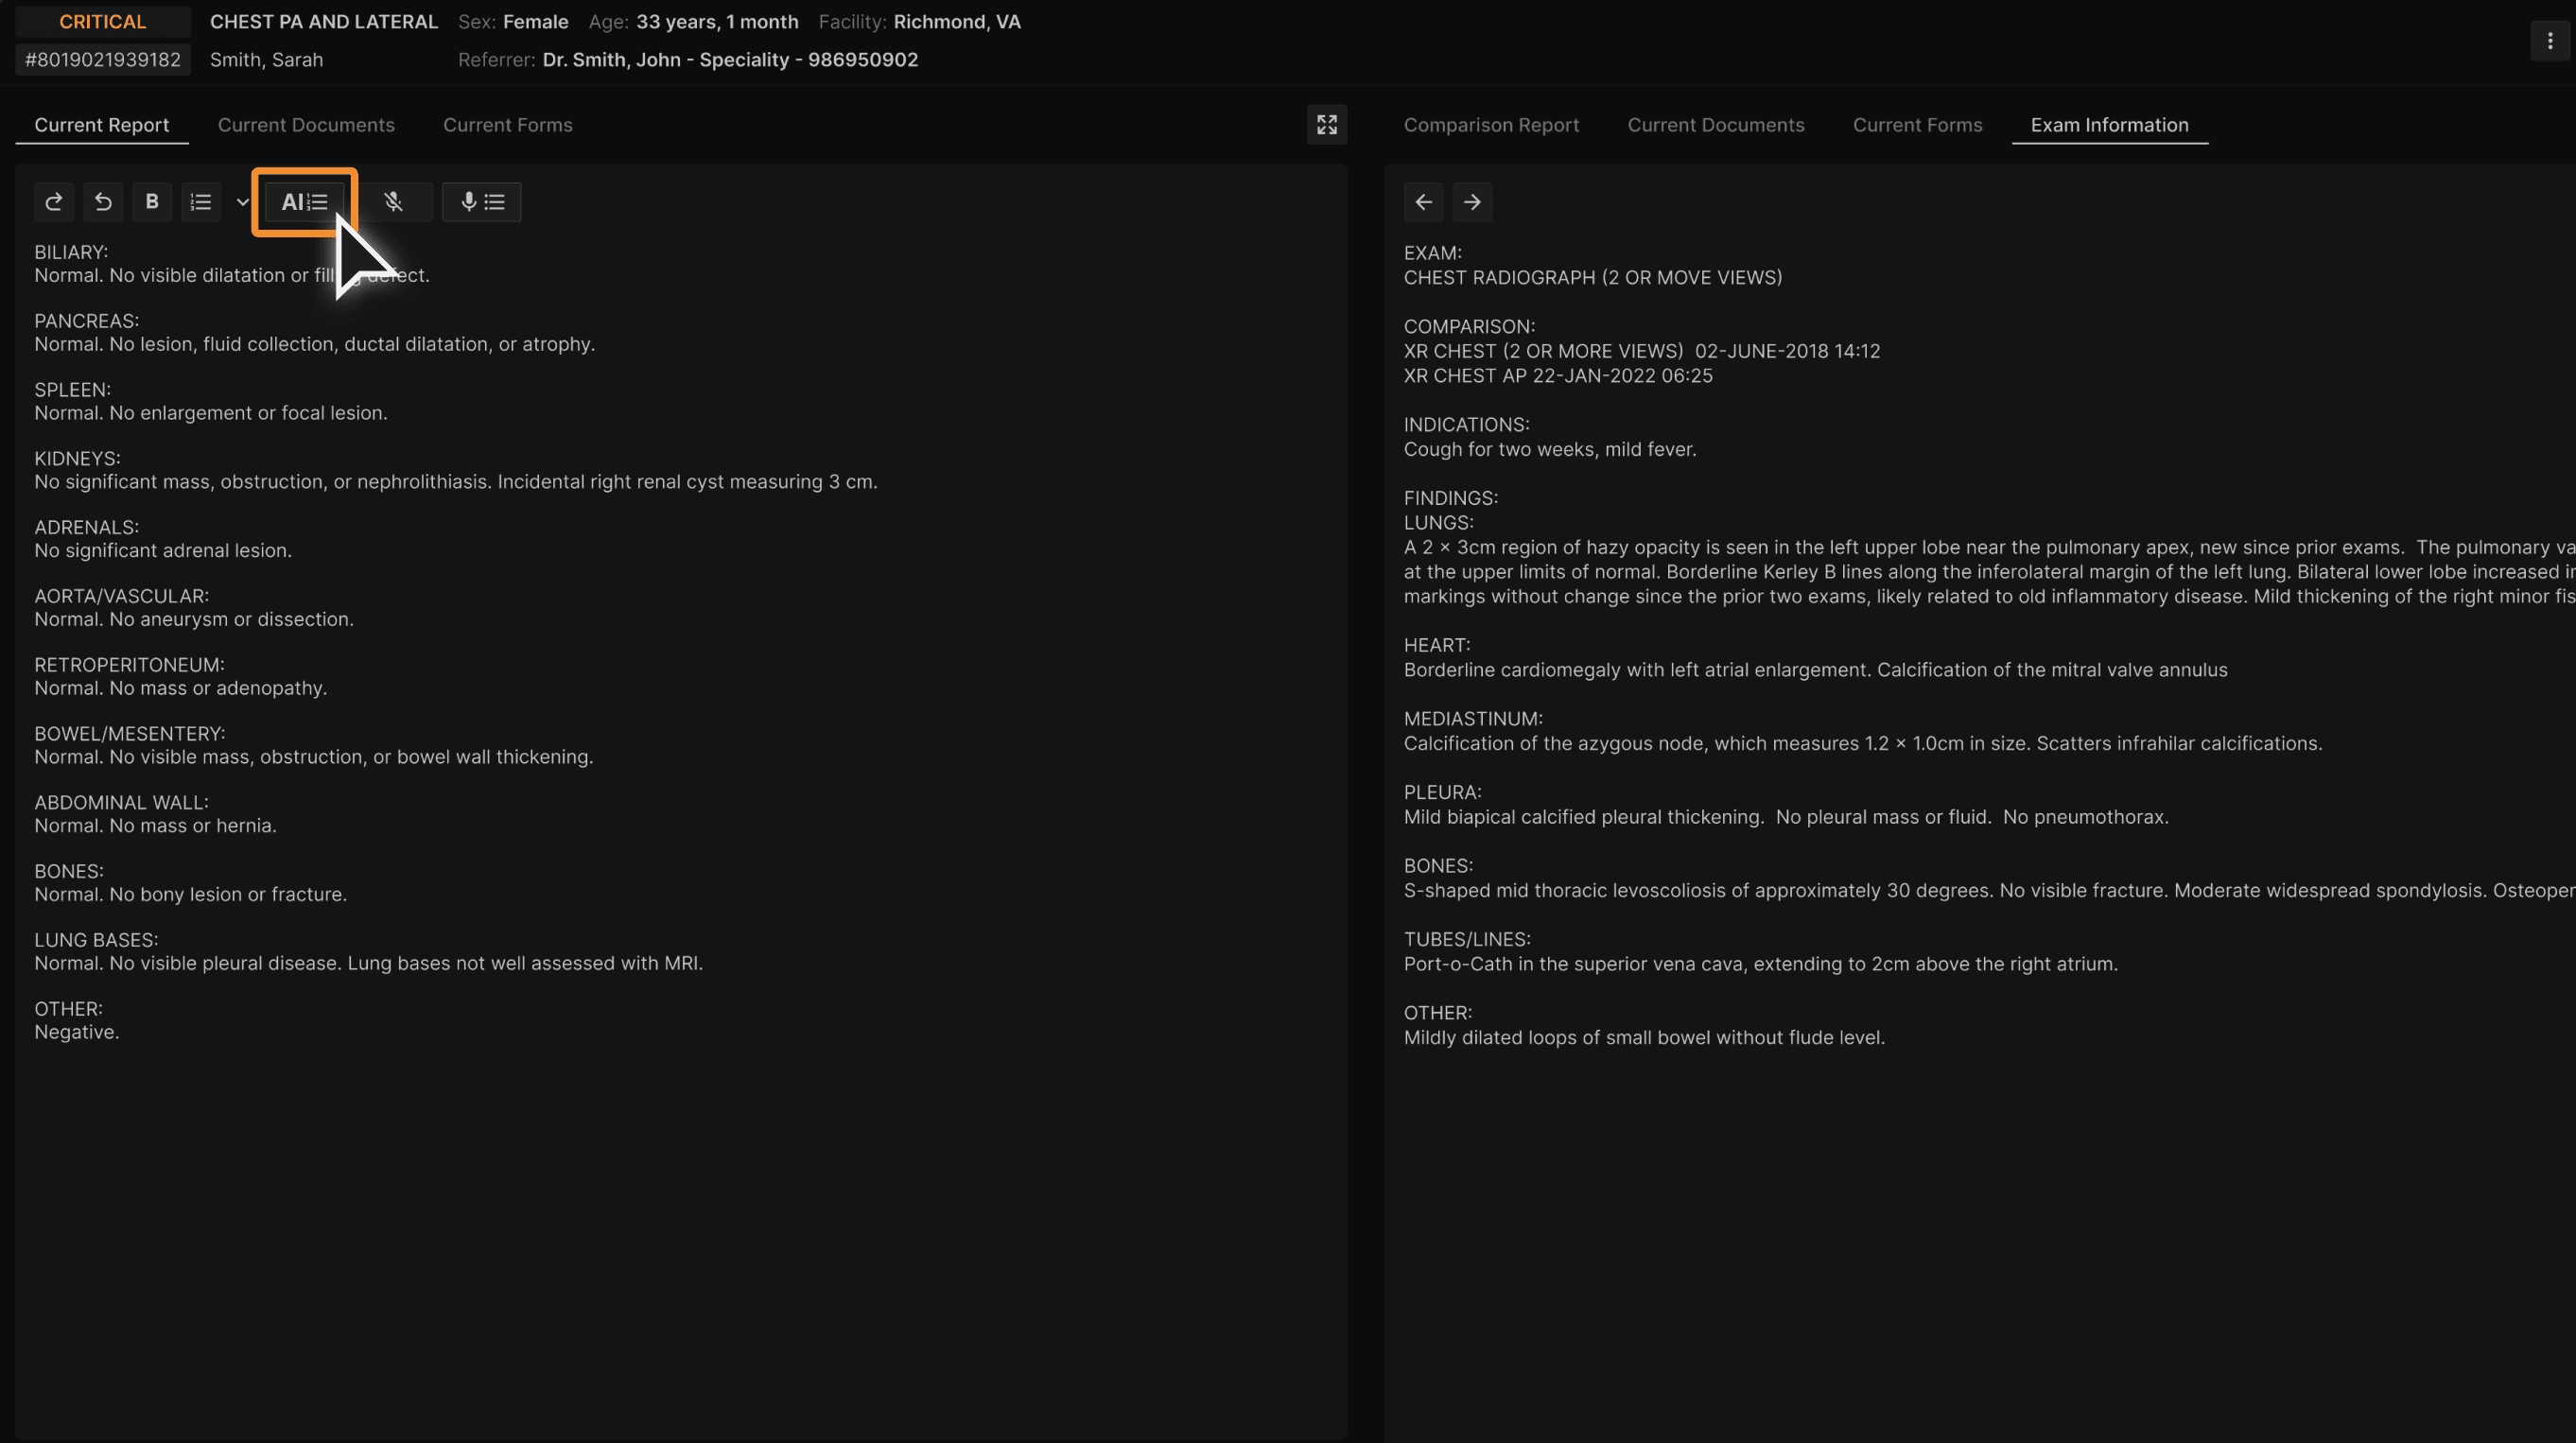 |
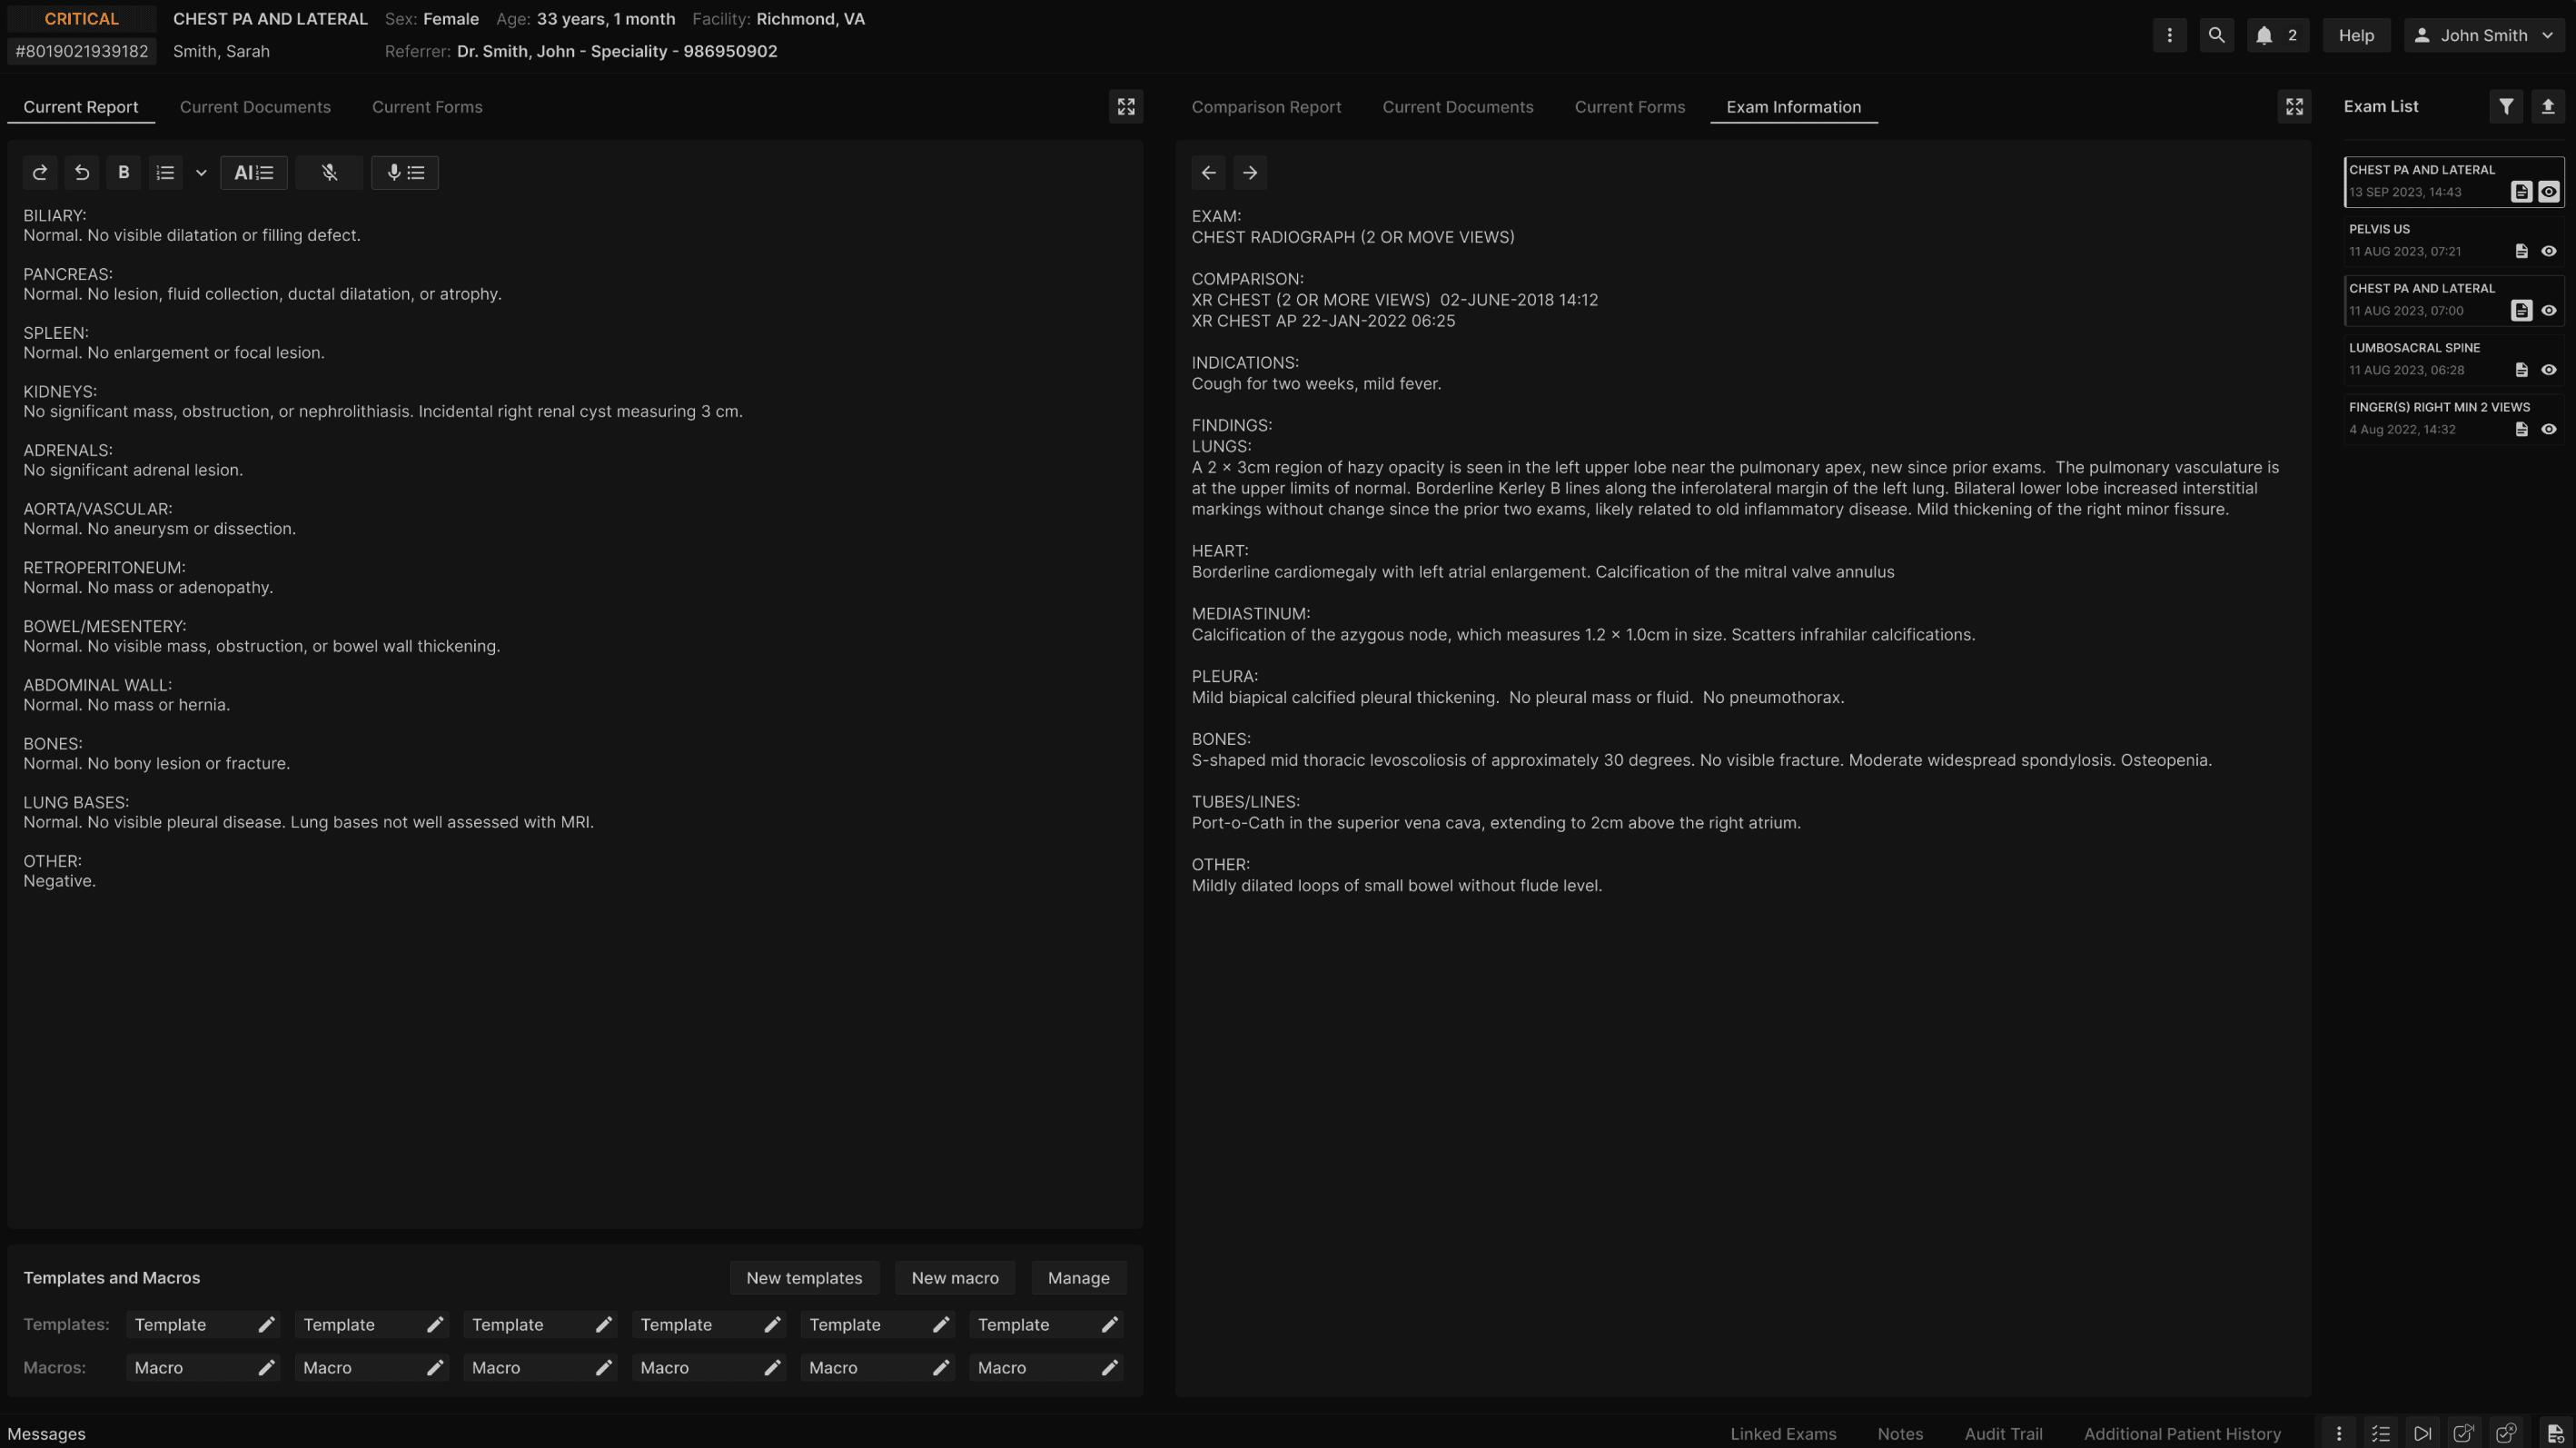
Consistent and clear list of impressions are generated in the IMPRESSION section. | |
|---|---|
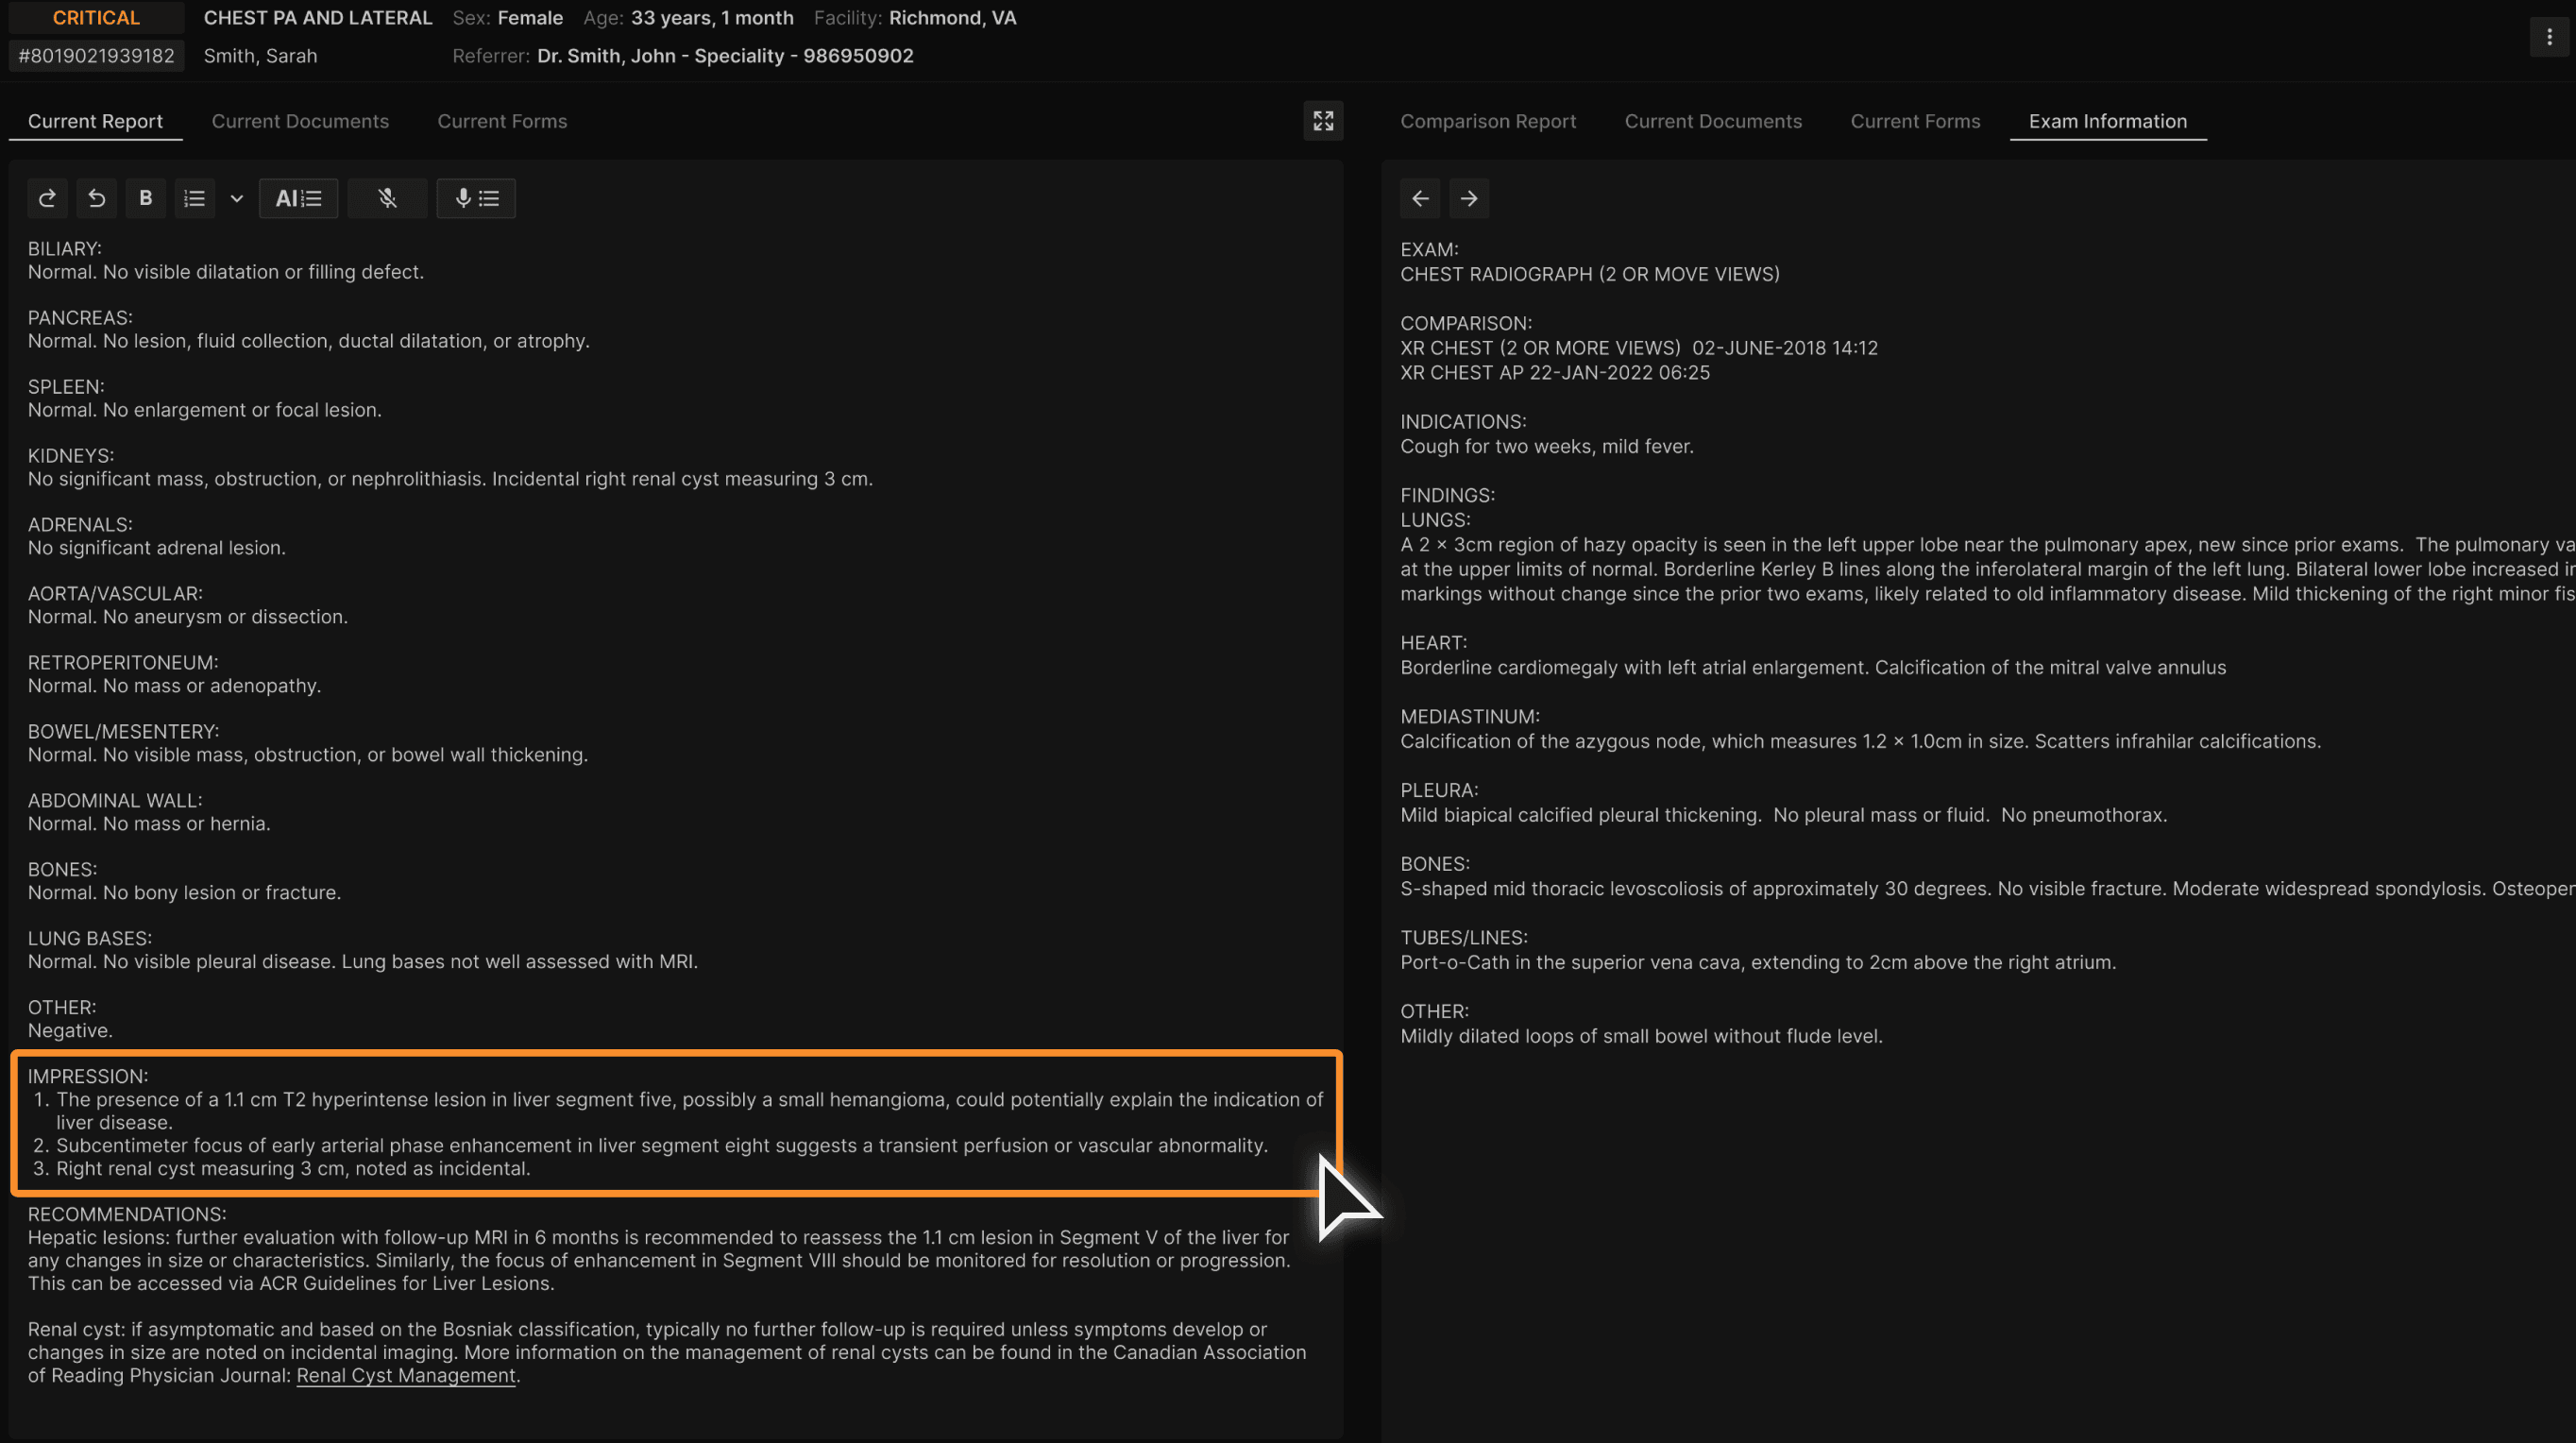 |
Report Recommendation 1.0
Gap | Gathering all the recommendations in the report can be time-consuming for the reading physicians. |
|---|---|
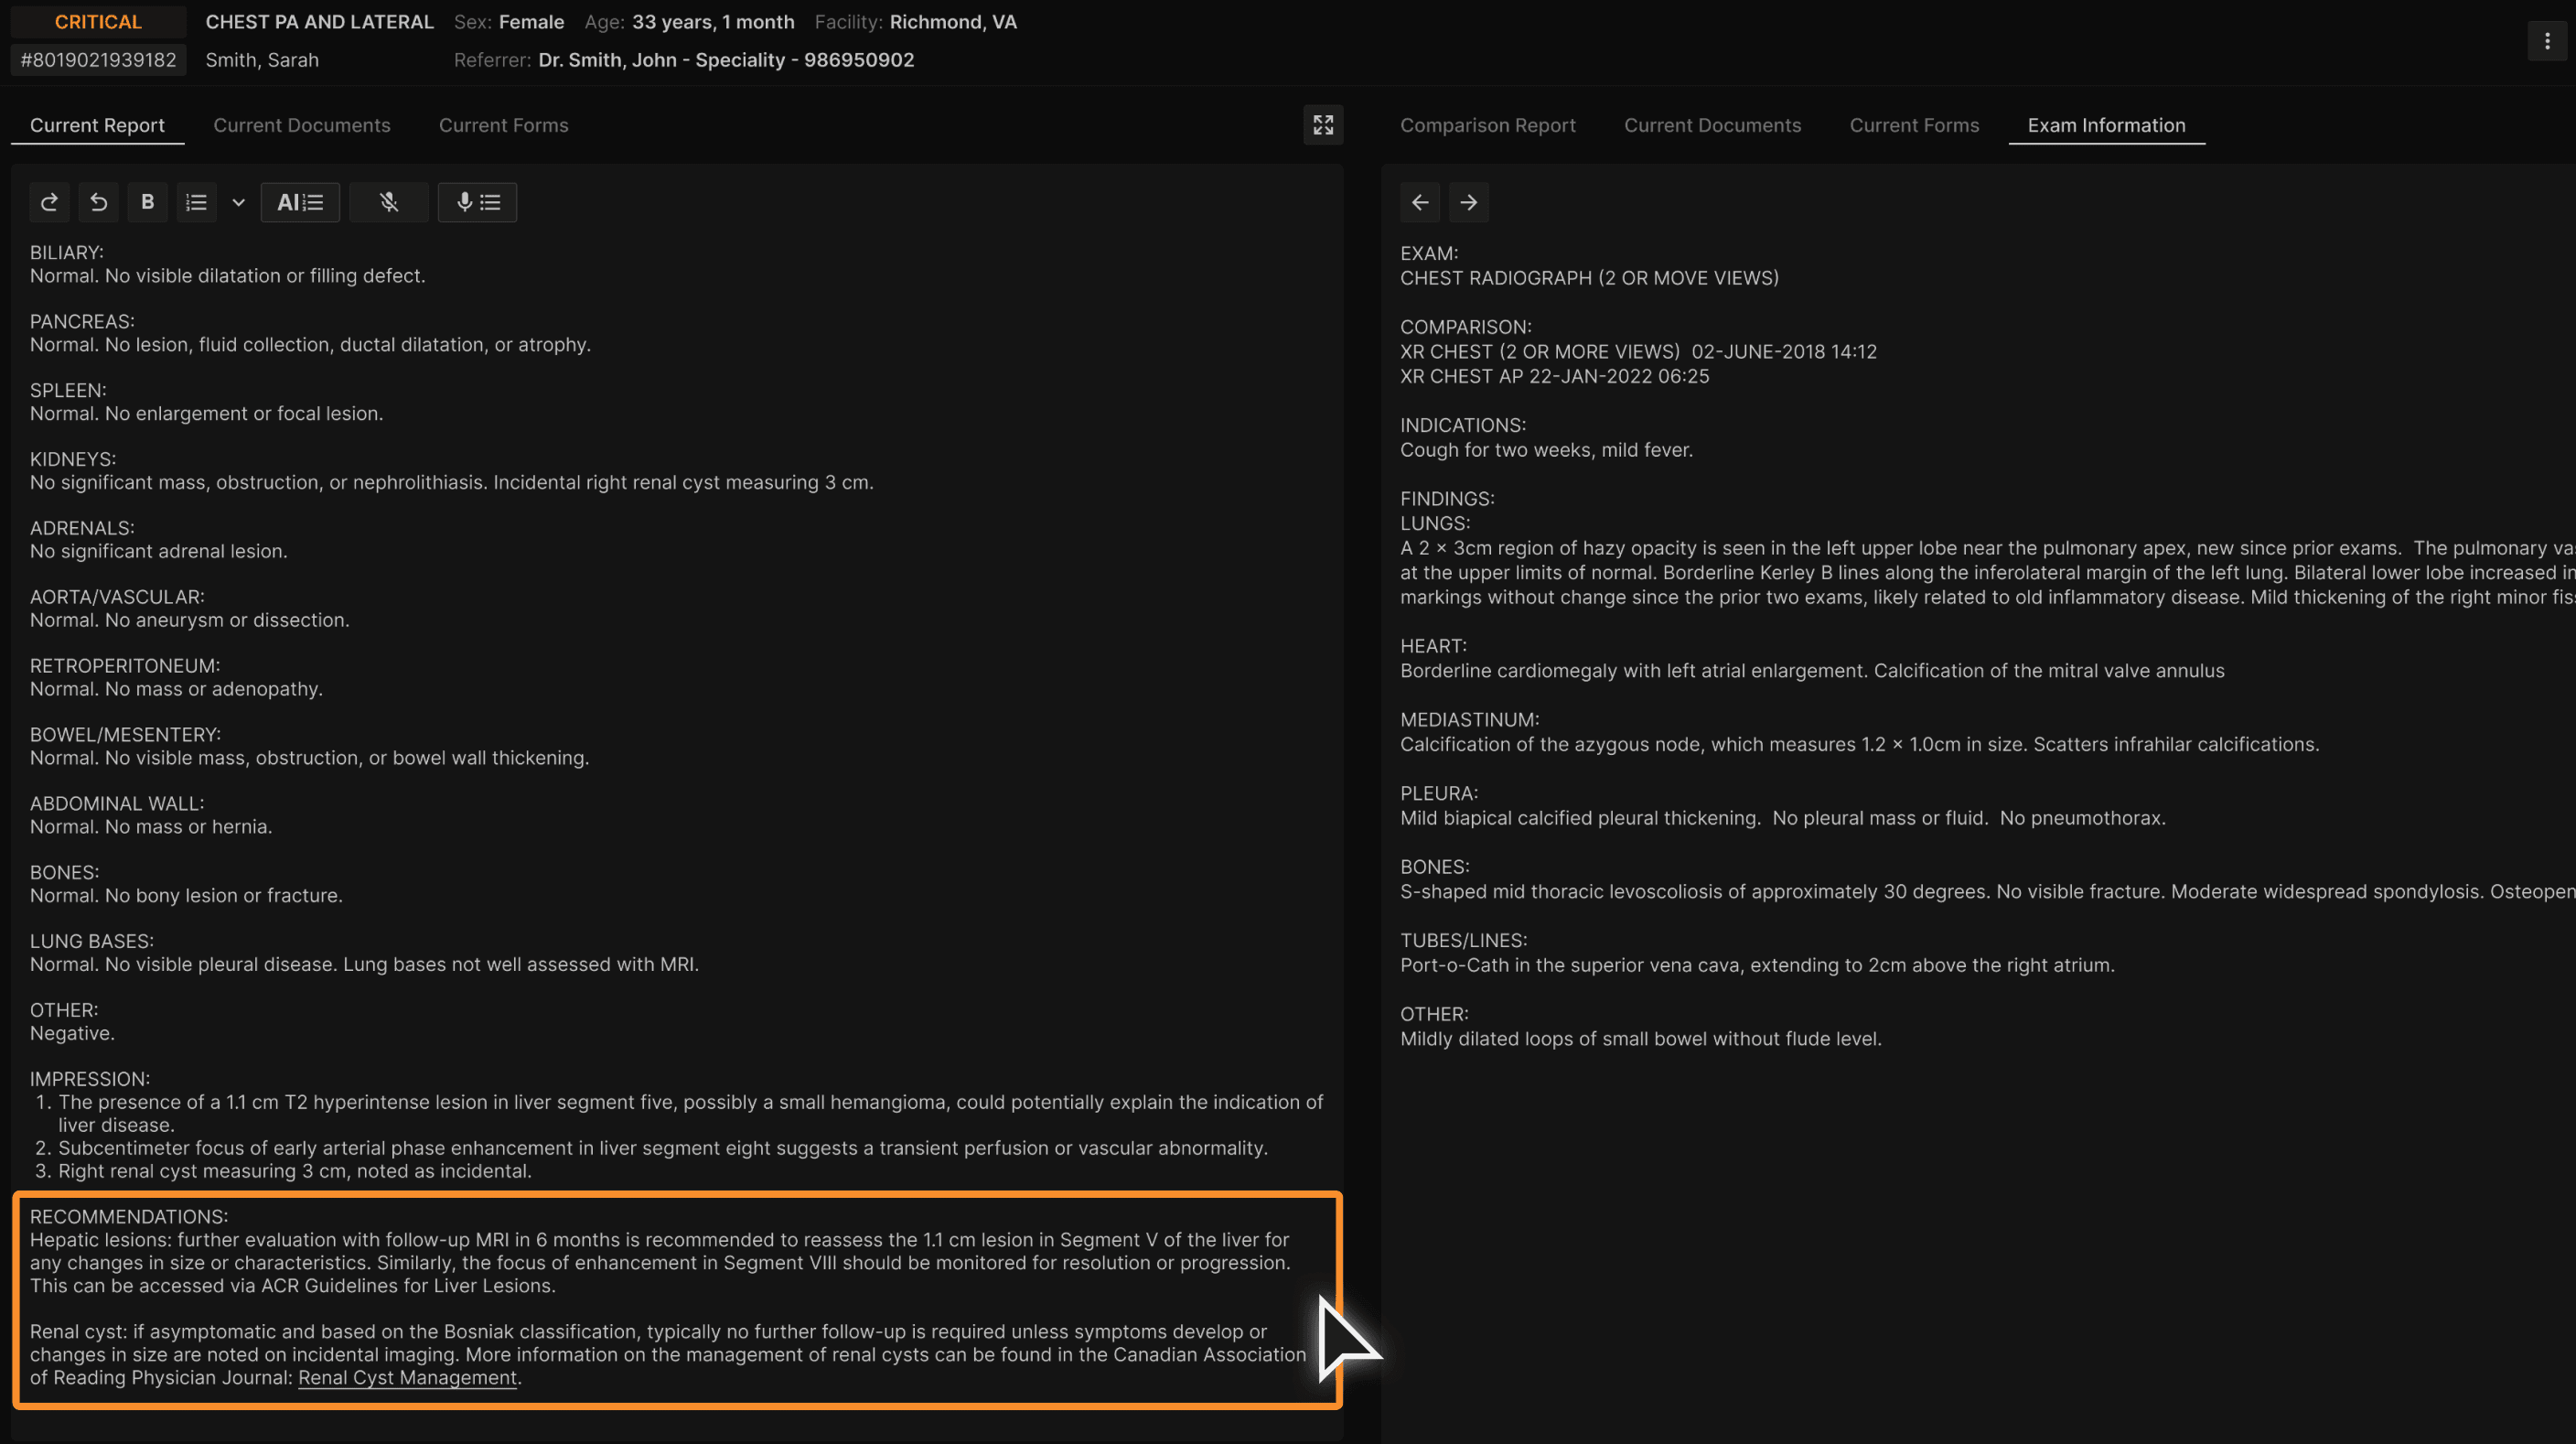
Solution | The Recommendation Agent extracts any mention of recommendations from the report and generates a list of concise recommendations that is organized under a new section in the report. |
User Flow:
Login and access the radiology report that contains recommendations. | |
|---|---|
 |
Select the "Impress" button. | |
|---|---|
|
Consistent and clear list recommendations is generated in the RECOMMENDATIONS section. | |
|---|---|
 |
Sub-Agent Development
Report Assistant 3.0 uses the following two sub-agents:
Main Agent | Report Assistant 3.0 |
|---|---|
Sub-Agent | Report Impression 1.0 |
Sub-Agent | Report Recommendation 1.0 |
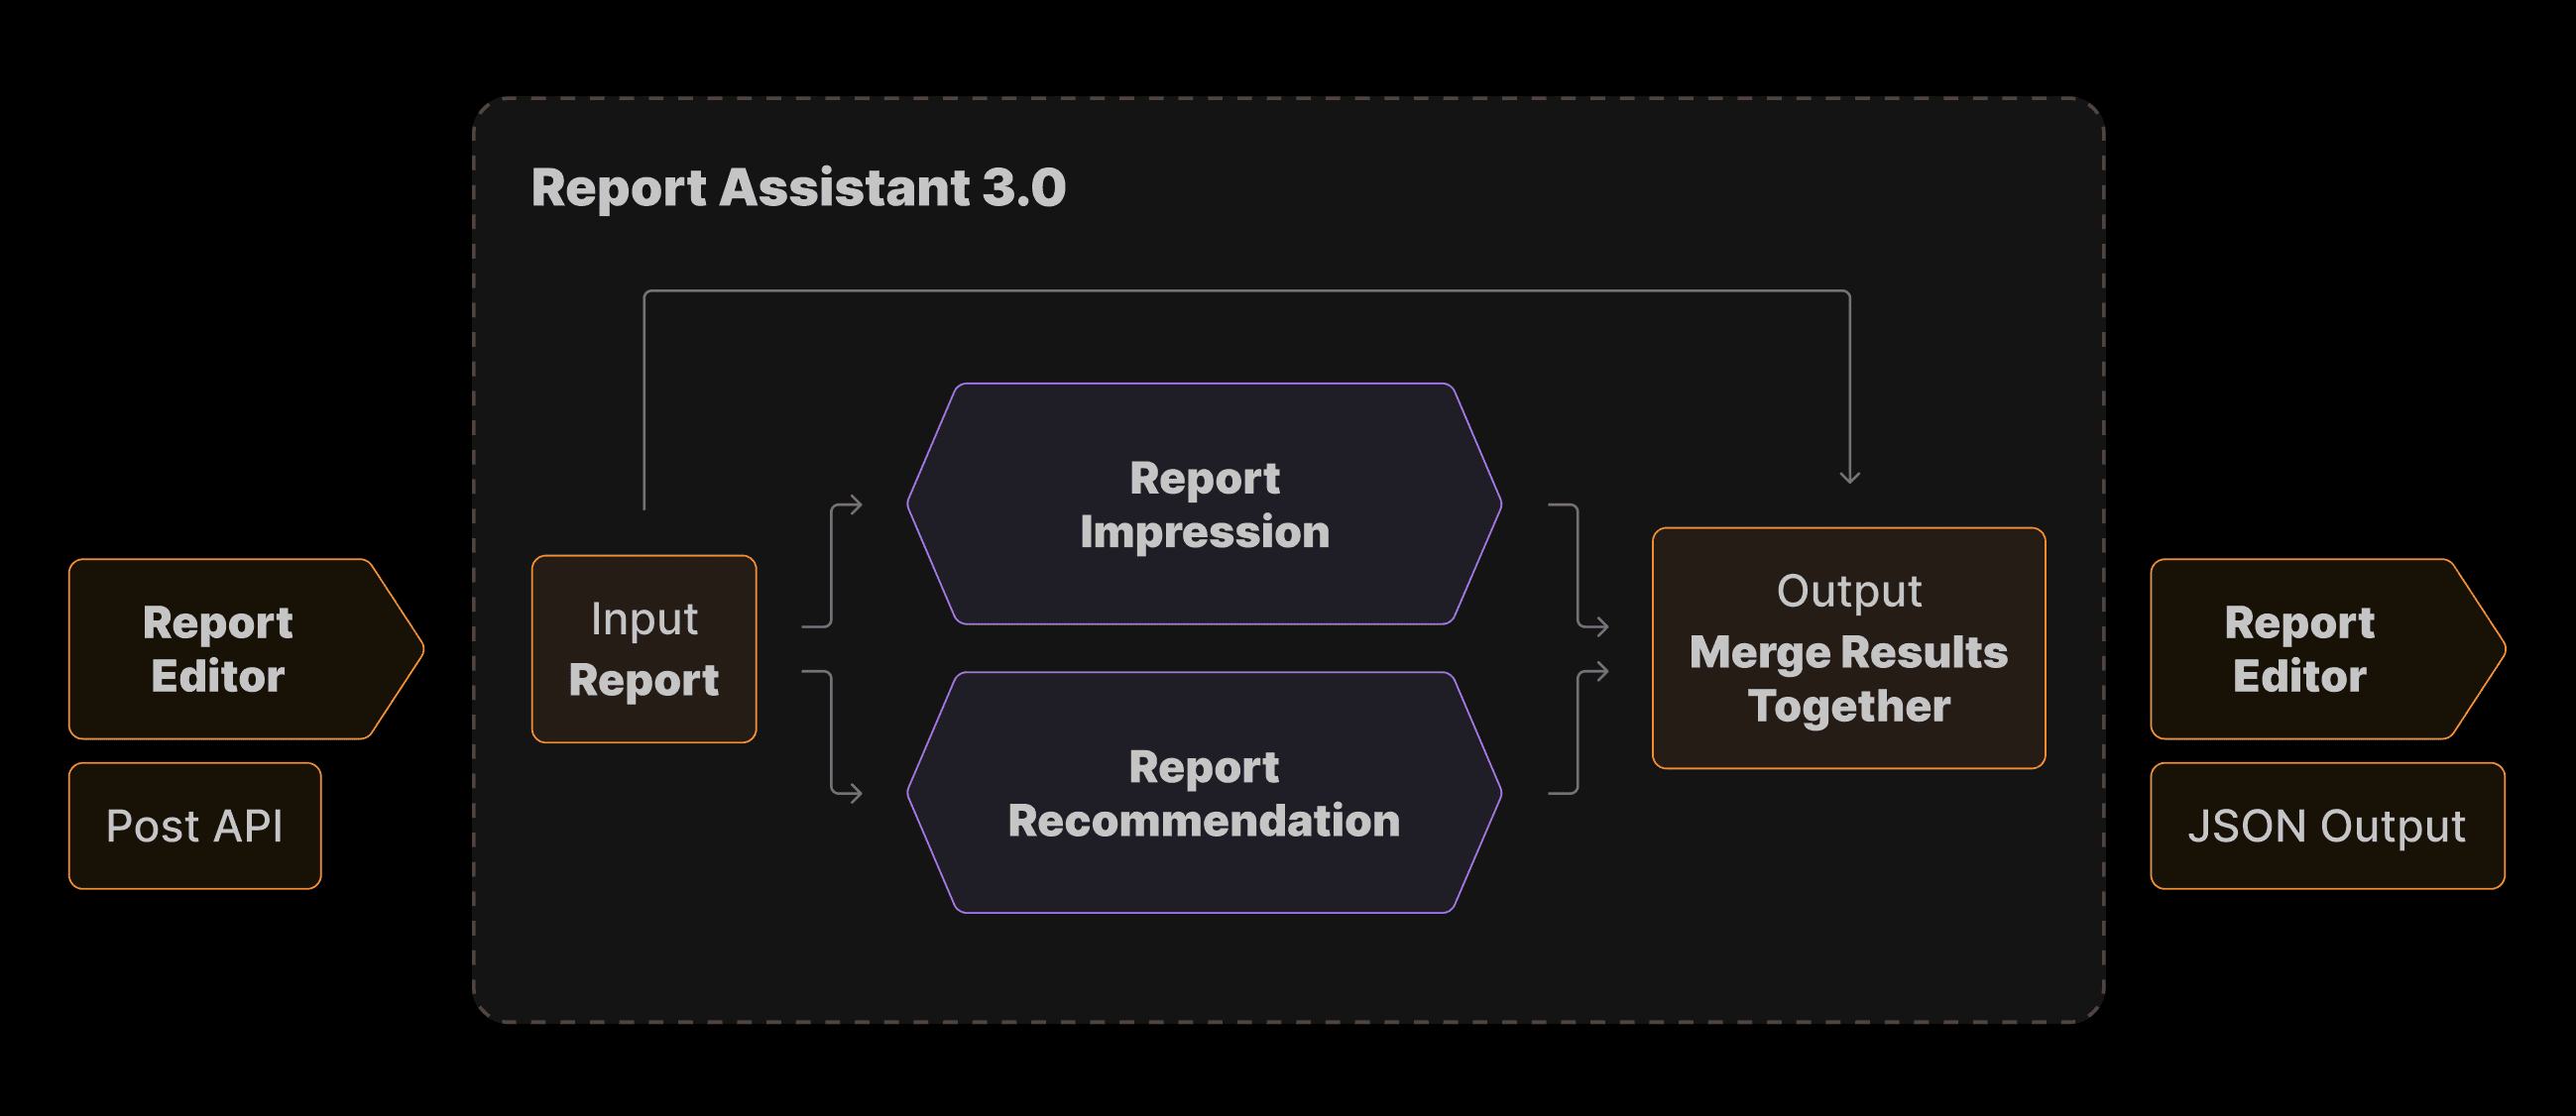
The main agent, Report Assistant, is responsible for orchestrating the information between its sub-agents and producing the final output. Communications between agents are done through secured POST API calls.
Flowchart
The logic is as follows: | |
|---|---|
Report Assistant takes a report as the input and makes parallel call to the two sub-agents to process it. | |
Report Assistant then takes the output and parses the result in a JSON structured output with the list of Impressions and Recommendations. If there are no recommendations, an empty list is sent out. | |
 |
Bench Testing & Performance Evaluation
Dataset Selection: Platform Data
We filtered reports from our database using the following conditions: |
|---|
|
|
|
|
|
330 reports were selected, focusing on fair distribution of gender, age group, facility, reading physician, report with recommendations, modality, and exam type. This was used as the final Bench Testing Set. The impressions and recommendations from these reports were clinically approved by the reading physicians and therefore could be used as the ground truth.
Dataset Distribution: Gender and Age Group | ||||||||||||||||||||||||||||||||||||||||
|---|---|---|---|---|---|---|---|---|---|---|---|---|---|---|---|---|---|---|---|---|---|---|---|---|---|---|---|---|---|---|---|---|---|---|---|---|---|---|---|---|
| ||||||||||||||||||||||||||||||||||||||||
| ||||||||||||||||||||||||||||||||||||||||
Dataset Distribution: Report with Recommendation, Facilities, and Gender | ||||||||||||||||||||||||||||
|---|---|---|---|---|---|---|---|---|---|---|---|---|---|---|---|---|---|---|---|---|---|---|---|---|---|---|---|---|
| ||||||||||||||||||||||||||||
| ||||||||||||||||||||||||||||
Dataset Distribution: US State, Modality, and Gender | ||||||||||||||||||||||||||||||||
|---|---|---|---|---|---|---|---|---|---|---|---|---|---|---|---|---|---|---|---|---|---|---|---|---|---|---|---|---|---|---|---|---|
| ||||||||||||||||||||||||||||||||
| ||||||||||||||||||||||||||||||||
Dataset Distribution: Reading Physician, Exam Type, and Gender | ||||||||||||||||||||||||||||||||
|---|---|---|---|---|---|---|---|---|---|---|---|---|---|---|---|---|---|---|---|---|---|---|---|---|---|---|---|---|---|---|---|---|
| ||||||||||||||||||||||||||||||||
| ||||||||||||||||||||||||||||||||
Description of Evaluation Metrics
Deterministic Evaluations:
|
|---|
Cosine Similarity |
Jaccard Similarity |
Levenshtein Similarity |
|
|
True Positives (TP) |
True Negatives (TN) |
False Positives (FP) |
False Negatives (FN) |
Accuracy |
Precision |
Sensitivity |
Specificity |
F1 Score |
LLM Grader Evaluations: |
|---|
|
|
|
Cosine Similarity
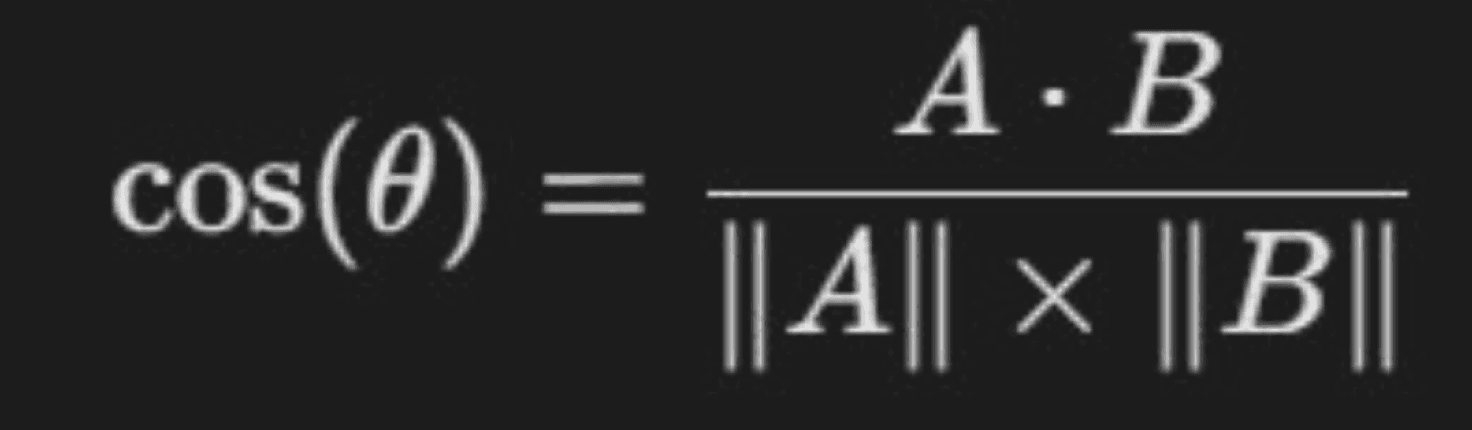
What it is: Cosine Similarity measures the angle between two text vectors, showing semantic closeness even if word order differs.
Formula |
|---|
 |
Example 1 (High Similarity) |
|---|
GT: “No acute intracranial abnormality is seen.” |
AI: “There is no evidence of acute intracranial pathology.” |
Cosine Similarity: 0.92 |
Example 2 (Low Similarity) |
|---|
GT: “Mild disc degeneration at L4-L5.” |
AI: “Fracture seen in the right femur.” |
Cosine Similarity: 0.36 |
Jaccard Similarity
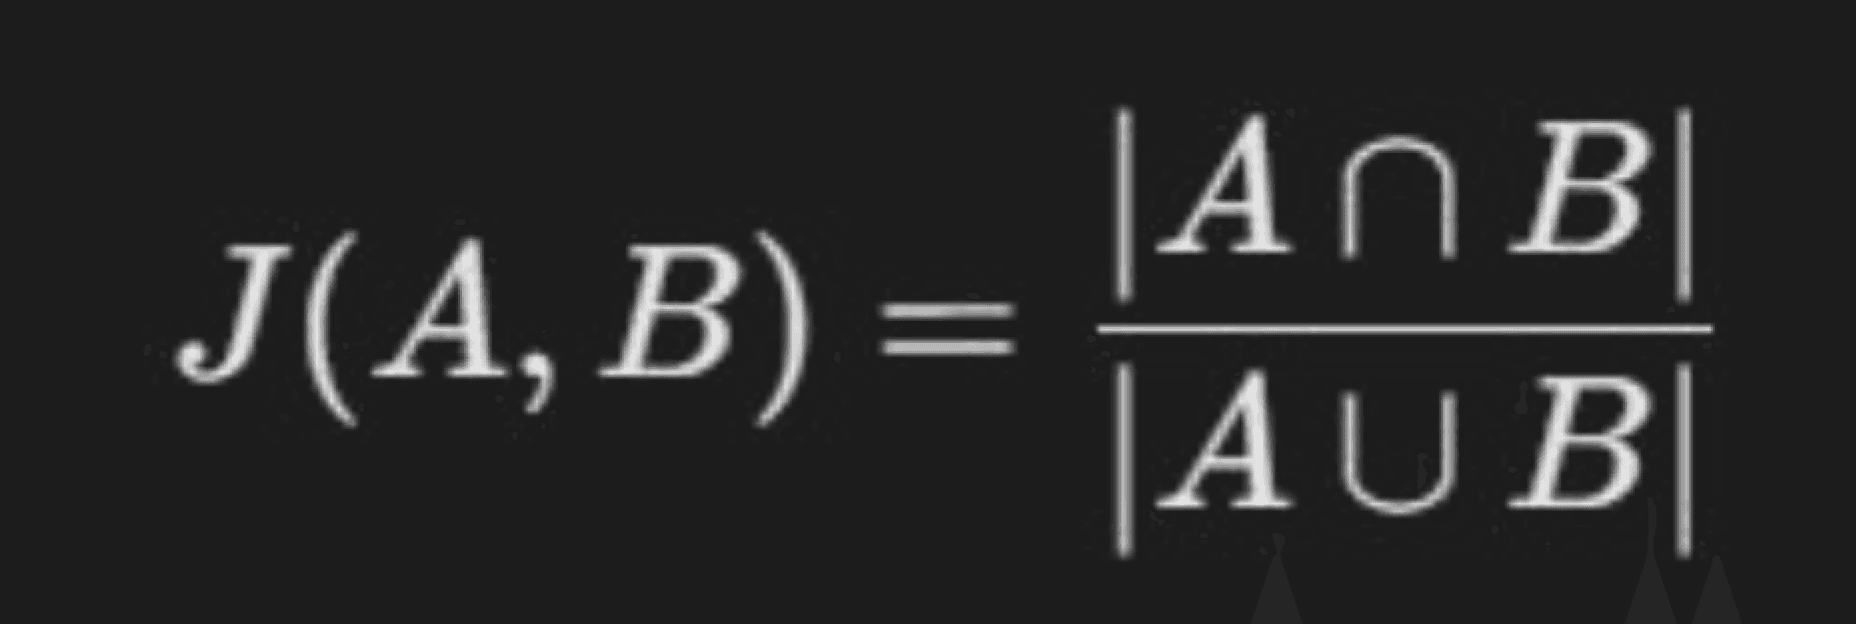
What it is: Jaccard Similarity measures the overlap of unique words between two strings.
Formula |
|---|
 |
Example 1 (Moderate Similarity) |
|---|
GT: “No acute intracranial abnormality is seen.” |
AI: “There is no evidence of acute intracranial pathology.” |
Jaccard Similarity: 0.53 |
Example 2 (Low Similarity) |
|---|
GT: “Mild disc degeneration at L4-L5.” |
AI: “Fracture seen in the right femur.” |
Jaccard Similarity: 0.15 |
Levenshtein Similarity
What it is: Measures edit distance, the number of character-level insertions, deletions, or substitutions needed to match two texts.
Formula |
|---|
 |
Example 1 (High Similarity) |
|---|
GT: “No acute intracranial abnormality is seen.” |
AI: “There is no evidence of acute intracranial pathology.” |
Levenshtein Similarity: 0.88 |
Example 2 (Low Similarity) |
|---|
GT: “Mild disc degeneration at L4-L5.” |
AI: “Fracture seen in the right femur.” |
Levenshtein Similarity: 0.42 |
Count of Items Generated
What it is: A simple yet informative metric, count the number of distinct items generated in the AI output and compare it to the ground truth (GT) provided by reading physicians.
Why it matters: |
|---|
Helps assess over generation or under generation. |
Indicates whether the AI is being too verbose or missing expected findings. |
Important for evaluating clinical usefulness and readability. |
Example: |
|---|
A. Ground Truth (GT) Impression (2 items): |
No acute intracranial abnormality. |
Mild chronic microvascular ischemic changes. |
B. AI-Generated Impression (4 items): |
No evidence of acute intracranial pathology. |
Mild chronic ischemic changes noted. |
Age-related brain atrophy present. |
No mass effect or midline shift. |
GT Count: 2 |
|---|
AI Count: 4 |
Difference: +2 (Overgeneration) |
Confusion Matrix
What it is: To determine the True Positives (TP), True Negatives (TN), False Positives (FP), and False Negatives (FN) of the AI agent in terms of at least generating one item if the GT has one or more item, and vice versa.
Why it's useful: Helps assess overall agent sensitivity and specificity at the report level.
Definitions of TP, TN, FP, FN:
For Impression Agent | ||
|---|---|---|
AI | GT | |
TP | At least one IMPRESSION item | At least one IMPRESSION item |
TN | No IMPRESSION item | No IMPRESSION item |
FP | At least one IMPRESSION item | No IMPRESSION item |
FN | No IMPRESSION item | At least one IMPRESSION item |
For Recommendation Agent | ||
|---|---|---|
AI | GT | |
TP | At least one RECOMMENDATION item | At least one RECOMMENDATION item |
TN | No RECOMMENDATION item | No RECOMMENDATION item |
FP | At least one RECOMMENDATION item | No RECOMMENDATION item |
FN | No RECOMMENDATION item | At least one RECOMMENDATION item |
Metric | AI |
|---|---|
Accuracy | Proportion of total correct predictions. |
Precision | How many predicted positives are correct. |
Sensitivity | How many actual positives were correctly predicted. |
Specificity | How many actual negatives were correctly predicted. |
F1 Score | Harmonic mean of precision and sensitivity. |
LLM Grader: AI-Based Quality Evaluation
A custom Chat Flow, powered by GPT-4o, was developed to evaluate AI-generated Impression and
Recommendation sections. The evaluation compares each AI output to both:
The Reading physician-reviewed Ground Truth (GT)
The Original Report written by the reading physician
Each AI output is scored on three key criteria, using a numeric scale from 0 to 1 along with textual justifications.
Evaluation Criteria |
|---|
Similarity Score |
How closely the AI output matches the Ground Truth in structure and meaning. |
Hallucination Score |
Assesses whether the AI introduces unsupported or fabricated content. |
Compares the AI output to the Original Report. |
Penalizes clinically incorrect or invented statements. |
Correctness Score |
Measures how accurately the AI reflects the clinical content in the Ground Truth. |
LLM Grader: Similarity Score
What it measures: |
|---|
Evaluates how closely the AI-generated section aligns in meaning and structure with the Ground Truth (GT). This score focuses on semantic overlap, organization, and phrasing consistency. |
Good Example – Score: 0.90 |
|---|
GT: "Slightly coarsened hepatic echotexture. 3.6 humeri simple right renal cyst." |
AI Output: "Slightly coarsened liver echotexture. 3.6 cm right renal simple cyst." |
Equivalent meaning with slight rephrasing and different synonyms. |
High alignment with GT content and structure. |
Bad Example – Score: 0.00 |
|---|
GT: "No renal stones or acute process seen." |
AI Output: "Lumbar fusion with mild S-shaped scoliosis and multilevel degenerative joint disease (DJD). Vascular calcifications noted." |
The AI response and GT have completely different content. |
The AI response mentions lumbar fusion, scoliosis, DJD, and vascular calcifications, while the GT states no renal stones or acute process. |
LLM Grader: Hallucination Score
What it measures: |
|---|
Assesses whether the AI introduces unsupported or fabricated findings not present in the Original Report. It focuses on clinical safety and factual grounding. |
Good Example – Score: 0.00 |
|---|
Original Report: "LIVER: Slightly coarsened echotexture without focal hepatic mass. Midclavicular length: 13.9 cm. RIGHT KIDNEY: Size: 10.7 x 4.0 x 5.2 cm (L x W x H). 3.6 cm right renal simple cyst. " |
AI Output: "Slightly coarsened liver echotexture. 3.6 cm right renal simple cyst." |
Faithful to source content |
No hallucinated findings or clinical interpretation |
Bad Example – Score: 0.25 |
|---|
Original Report: "PRE-FINDINGS: EXAM: CT OF THE HEAD/BRAIN WITHOUT INTRAVENOUS CONTRAST COMPARISON: None. INDICATIONS: TRAUMA TECHNIQUE: An axial spiral CT examination was performed without intravenous contrast. In addition, sagittal and coronal reformatted images were created and reviewed. This CT uses dose modulation, interval reconstruction, and/or weight-based dosing when appropriate to reduce radiation dose to as low as reasonably achievable. FINDINGS: BRAIN INCLUDING MENINGES AND EXTRA AXIAL SPACES: Acute abnormality. Severe chronic small vessel disease. Generalized cerebral volume loss. The hippocampi appear decreased in volume, with extra vacuum enlargement of the temporal horns. No upward bowing of the corpus callosum or asymmetric narrowing of the hy- convexity sulci is suggests hydrocephalus. VASCULATURE: No atherosclerotic changes in the major vessels. PITUITARY: No mass or deformity of the sella. SKULL: No significant lesion or fracture. SINUSES: Limited views demonstrate no significant mucosal thickening or fluid. ORBITS: Left-sided scleral band. Right lens replacement. OTHER: There are scattered foci of air in the left masticator space and in the left preauricular region. Trace left mastoid effusion." |
AI Output: "Acute abnormality in the brain. Severe chronic small vessel disease. Generalized cerebral volume loss with decreased hippocampal volume and enlargement of temporal horns. Left-sided scleral band and right lens replacement. Scattered foci of air in the left masticator space and left preauricular region. Trace left mastoid effusion. ” |
The AI response is mostly grounded in the Original Report, but it incorrectly states an 'acute abnormality in the brain,' which is not supported by the Original Report. Other findings are consistent with the Original Report. |
LLM Grader: Correctness Score
What it measures: |
|---|
Evaluates how accurately the AI captures the clinical meaning of the Ground Truth. Focuses on factual consistency and correct medical interpretation. |
Good Example – Score: 1.00 |
|---|
GT: "Slightly coarsened hepatic echotexture. 3.6 humeri simple right renal cyst." |
AI Output: "Slightly coarsened liver echotexture. 3.6 cm right renal simple cyst." |
Clinically aligned and accurate. |
Different medical terms used, still valid. |
Bad Example – Score: 0.5 |
|---|
GT: "No renal stones or acute process seen." |
AI Output: "Lumbar fusion with mild S-shaped scoliosis and multilevel degenerative joint disease (DJD). Vascular calcifications noted." |
The AI response is plausible as it accurately reflects findings from the Original Report, but it does not align with the GT, which mentions no renal stones or acute process. |
Human Expert Evaluation
An expert Canadian and US Board Certified reading physician with 20+ years of experience, fellowship training in pediatrics, interventional radiology and a mini fellowship in musculoskeletal imaging was assigned to manually review the original reports alongside the AI-generated Impressions and Recommendations for the 330 cases that comprise our benchmark testing set.
An expert Canadian and US Board Certified reading physician with 20+ years of experience, fellowship training in pediatrics, interventional radiology and a mini fellowship in musculoskeletal imaging was assigned to manually review the original reports alongside the AI-generated Impressions and Recommendations for the 330 cases that comprise our benchmark testing set. | ||
|---|---|---|
| ||
5 → Fully Correct | ||
4 → Minor inaccuracies | ||
3 → Half correct items | ||
2 → Major inaccuracies | ||
1 → Fully incorrect | ||
| ||
No Hallucination → All AI results are grounded and are based on the original report | ||
Not Applicable → There is no recommendation in the original report and AI correctly generated no recommendations; Therefore Hallucination score doesn't apply here. | ||
Contains Hallucination → The generated results contain information outside the original report |
Human Expert Evaluation - Overall Report Level Results
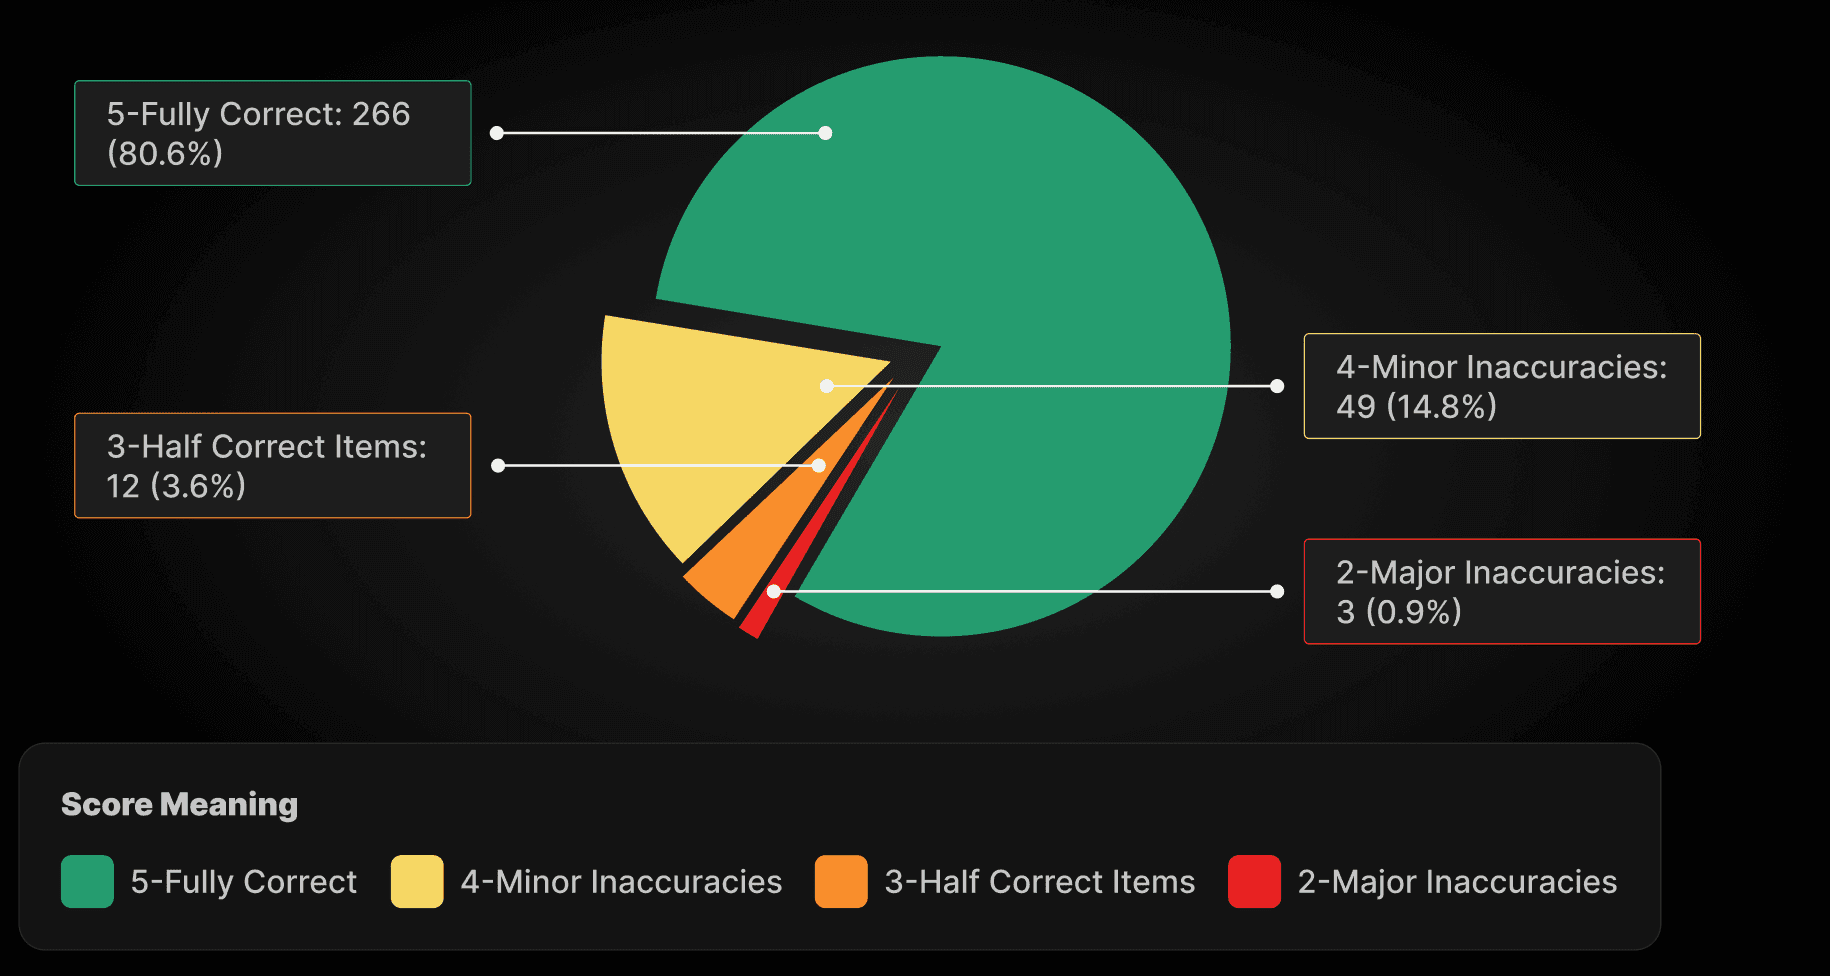
Correctness Score:
Correctness Score-Meaning | Count (Percentage) |
|---|---|
5-Fully Correct | 266 (80.6%) |
4-Minor Inaccuracies | 49 (14.8%) |
3-Half Correct Items | 12 (3.6%) |
2-Major Inaccuracies | 3 (0.9%) |
1-Fully Incorrect | 0 (0.0%) |
Total | 330 (100%) |
Statistical Summary | Value |
|---|---|
Count | 330 |
Mean | 4.75 |
Median | 5 |
Std Dev | 0.56 |
Min | 2 |
Max | 5 |
Mode | 5 (appeared 266 times) |
Correctness Score Distribution for 330 Reports | |
|---|---|
 |
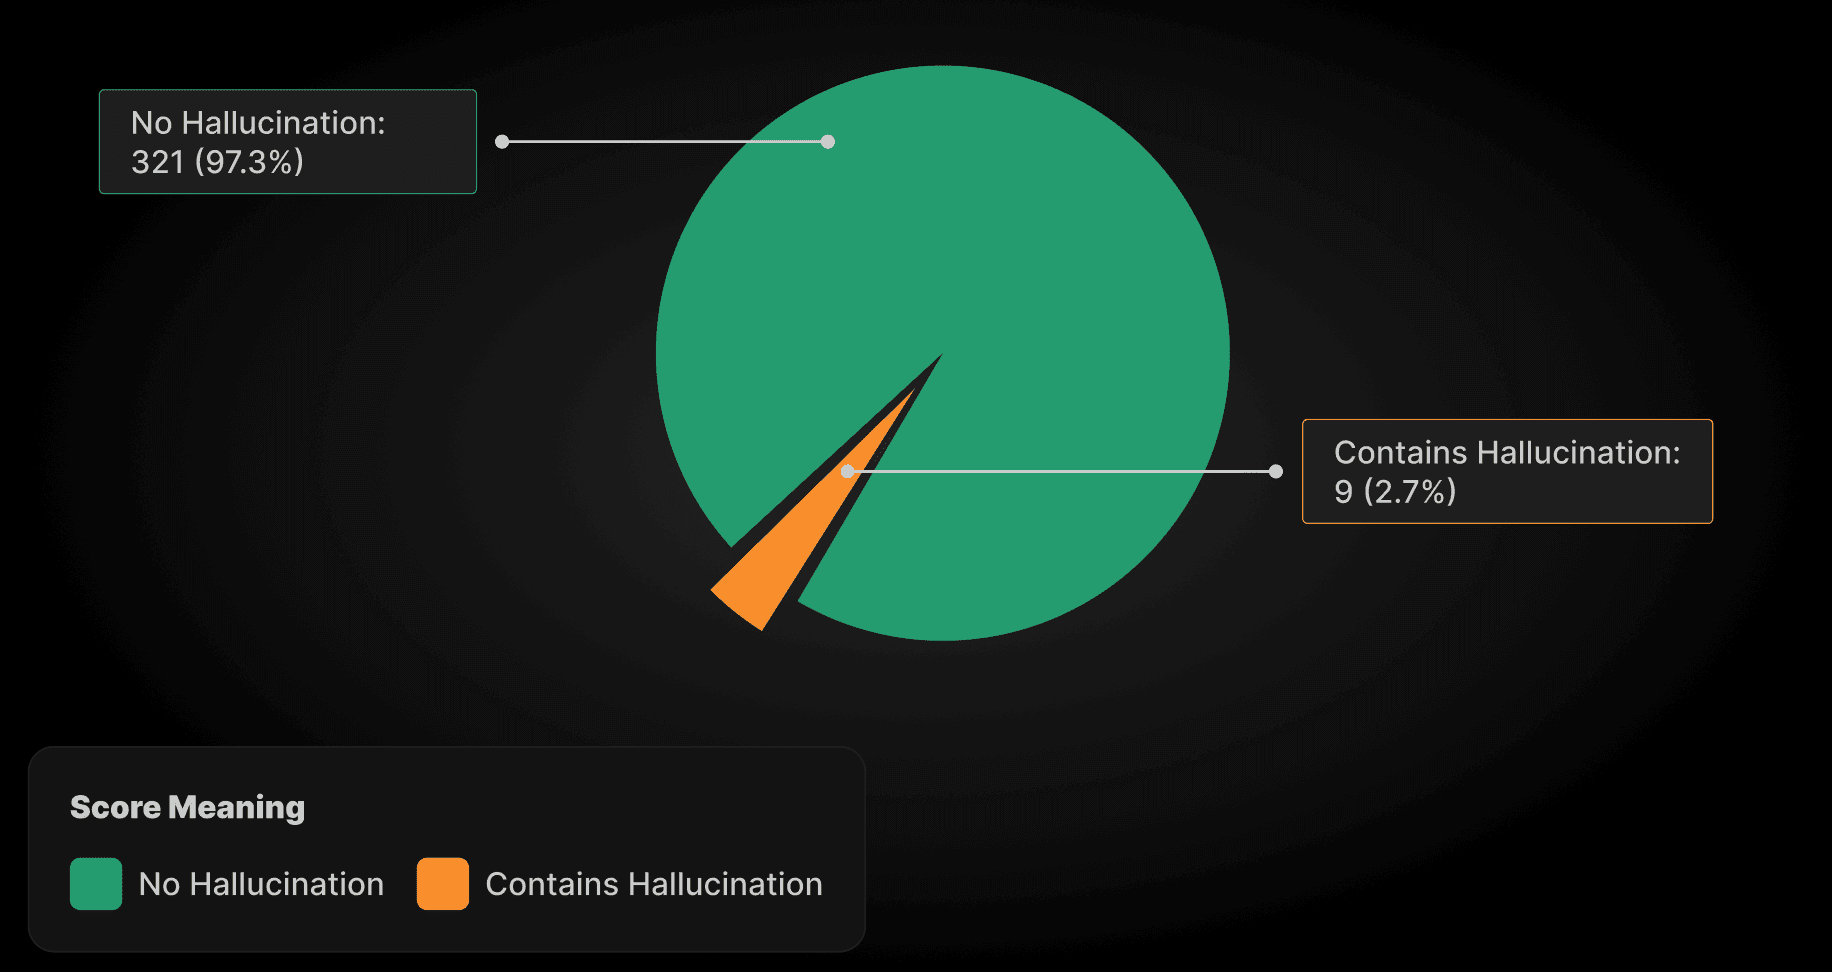
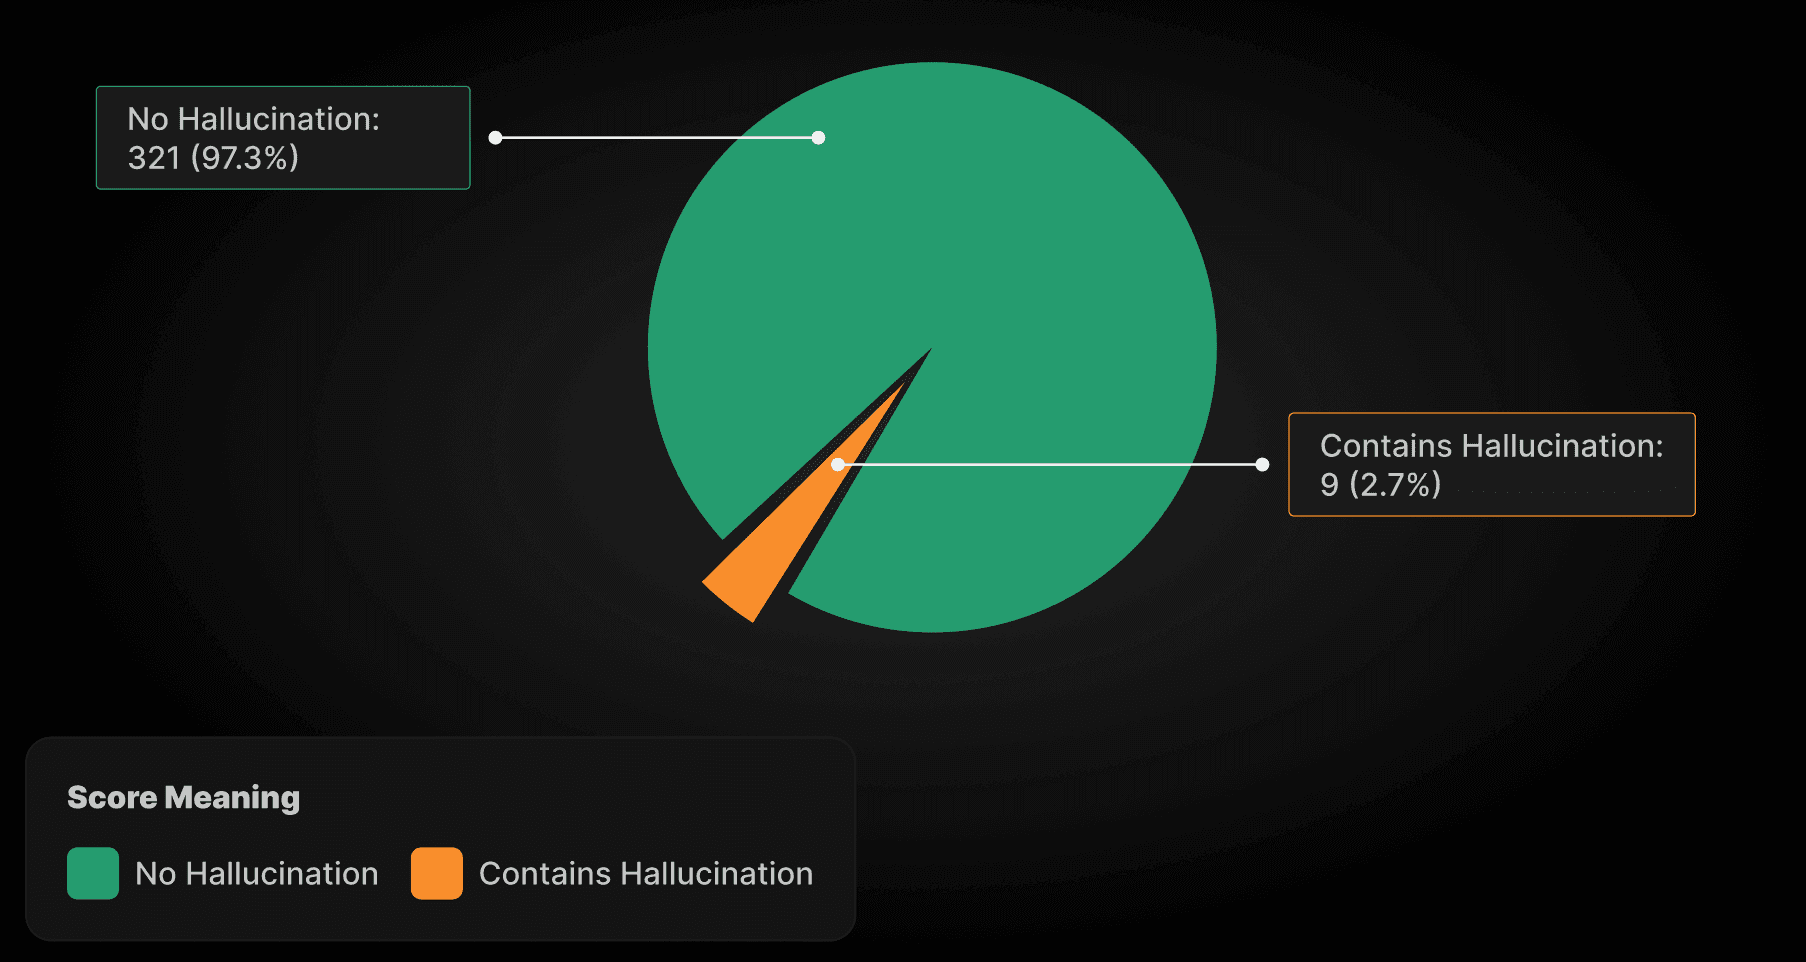
Hallucination Score: | |
|---|---|
Correctness Score-Meaning | Count (Percentage) |
No Hallucination | 321 (97.3%) |
Contains Hallucination | 9 (2.7%) |
Total | 330 (100%) |
Hallucination Score Distribution for 330 Reports | |
|---|---|
 |
Human Expert Evaluation - Report Impression 1.0 - Impressions Only
Correctness Score:
Correctness Score-Meaning | Count (Percentage) |
|---|---|
5-Fully Correct | 266 (80.6%) |
4-Minor Inaccuracies | 49 (14.8%) |
3-Half Correct Items | 12 (3.6%) |
2-Major Inaccuracies | 3 (0.9%) |
1-Fully Incorrect | 0 (0.0%) |
Total | 330 (100%) |
Statistical Summary | Value |
|---|---|
Count | 330 |
Mean | 4.75 |
Median | 5 |
Std Dev | 0.56 |
Min | 2 |
Max | 5 |
Mode | 5 (appeared 266 times) |
Correctness Score Distribution for 330 Reports | |
|---|---|
 |
Hallucination Score: | |
|---|---|
Correctness Score-Meaning | Count (Percentage) |
No Hallucination | 321 (97.3%) |
Contains Hallucination | 9 (2.7%) |
Total | 330 (100%) |
Correctness Score Distribution for 330 Reports | |
|---|---|
 |
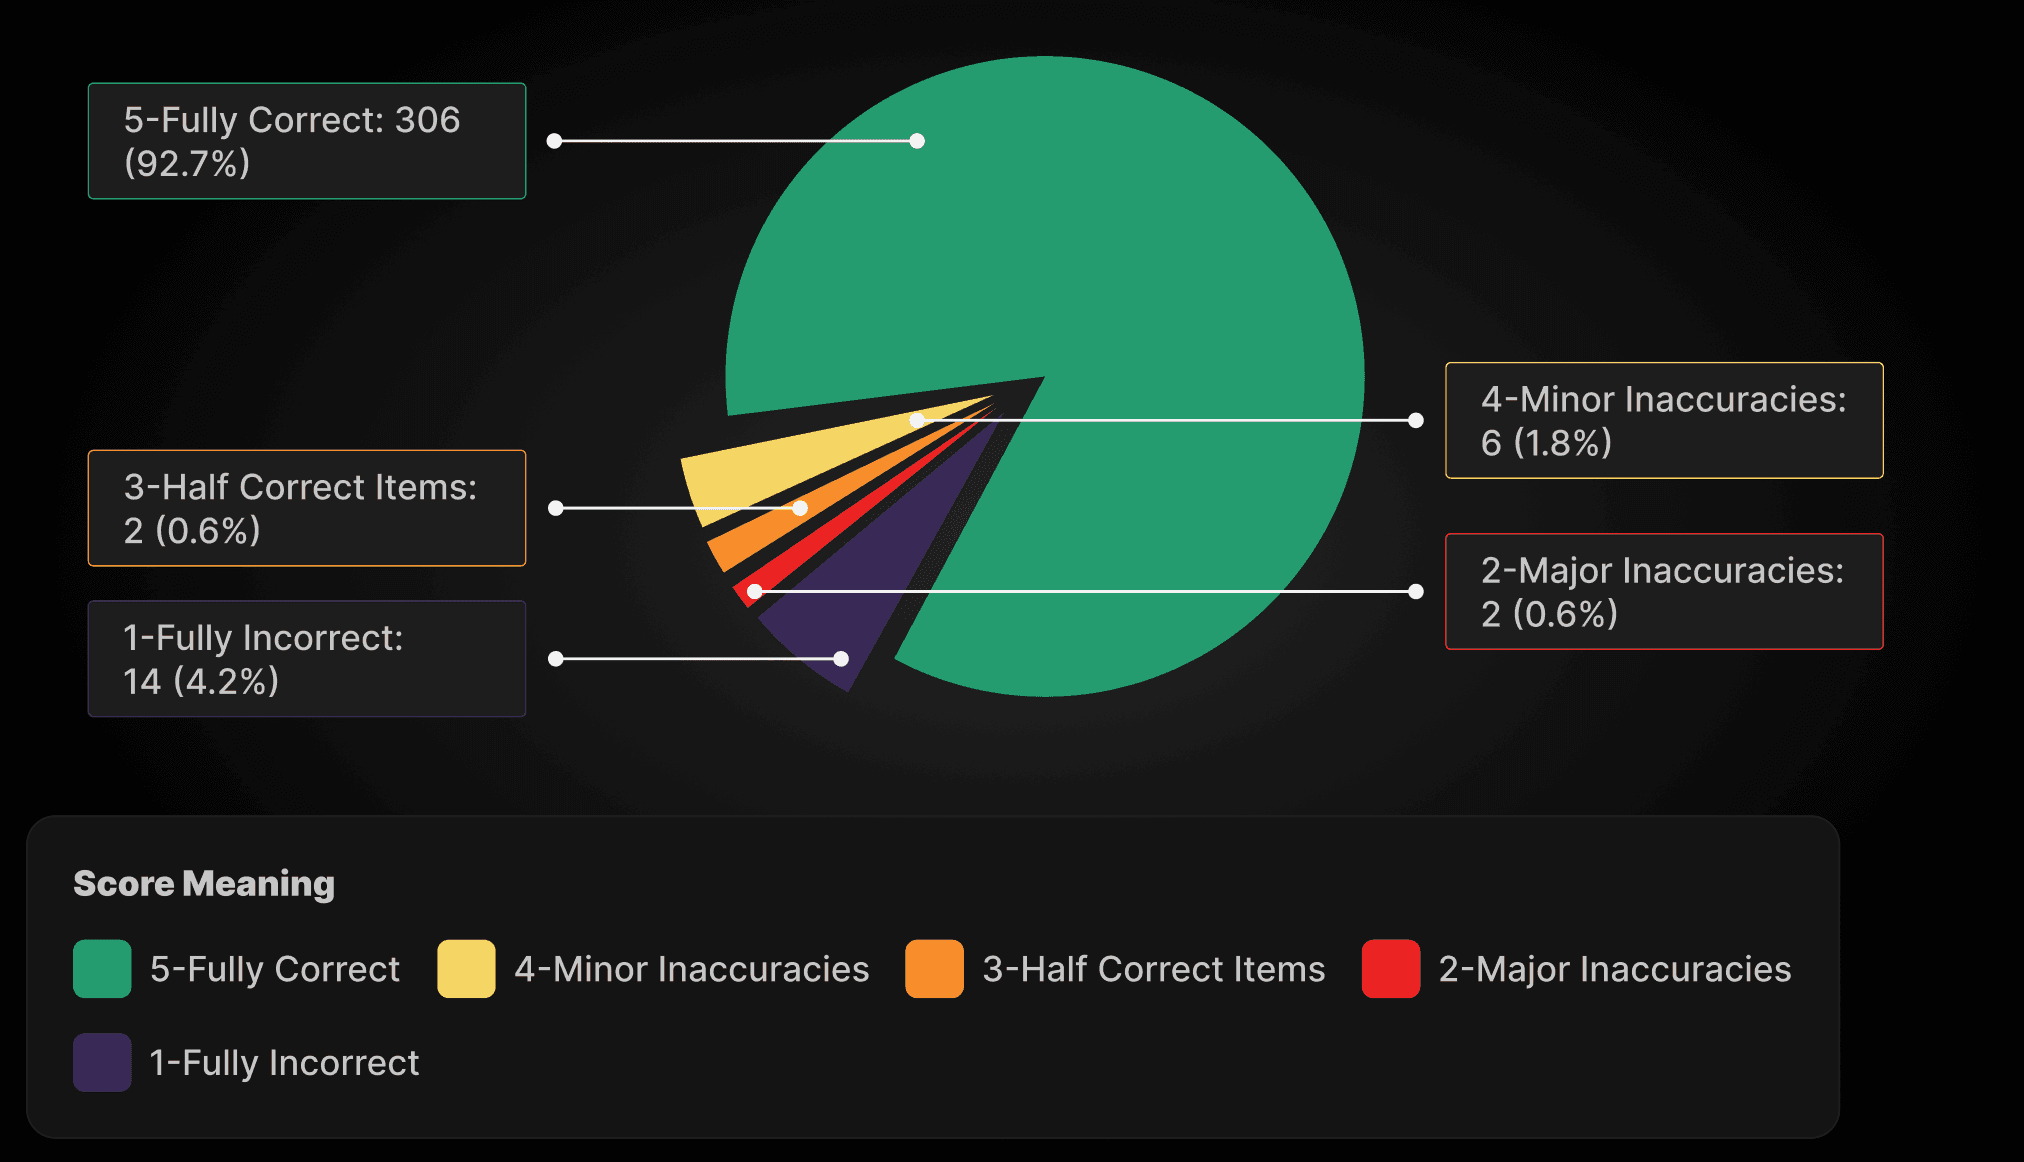
Human Expert Evaluation - Report Impression 1.0 - Impressions Only
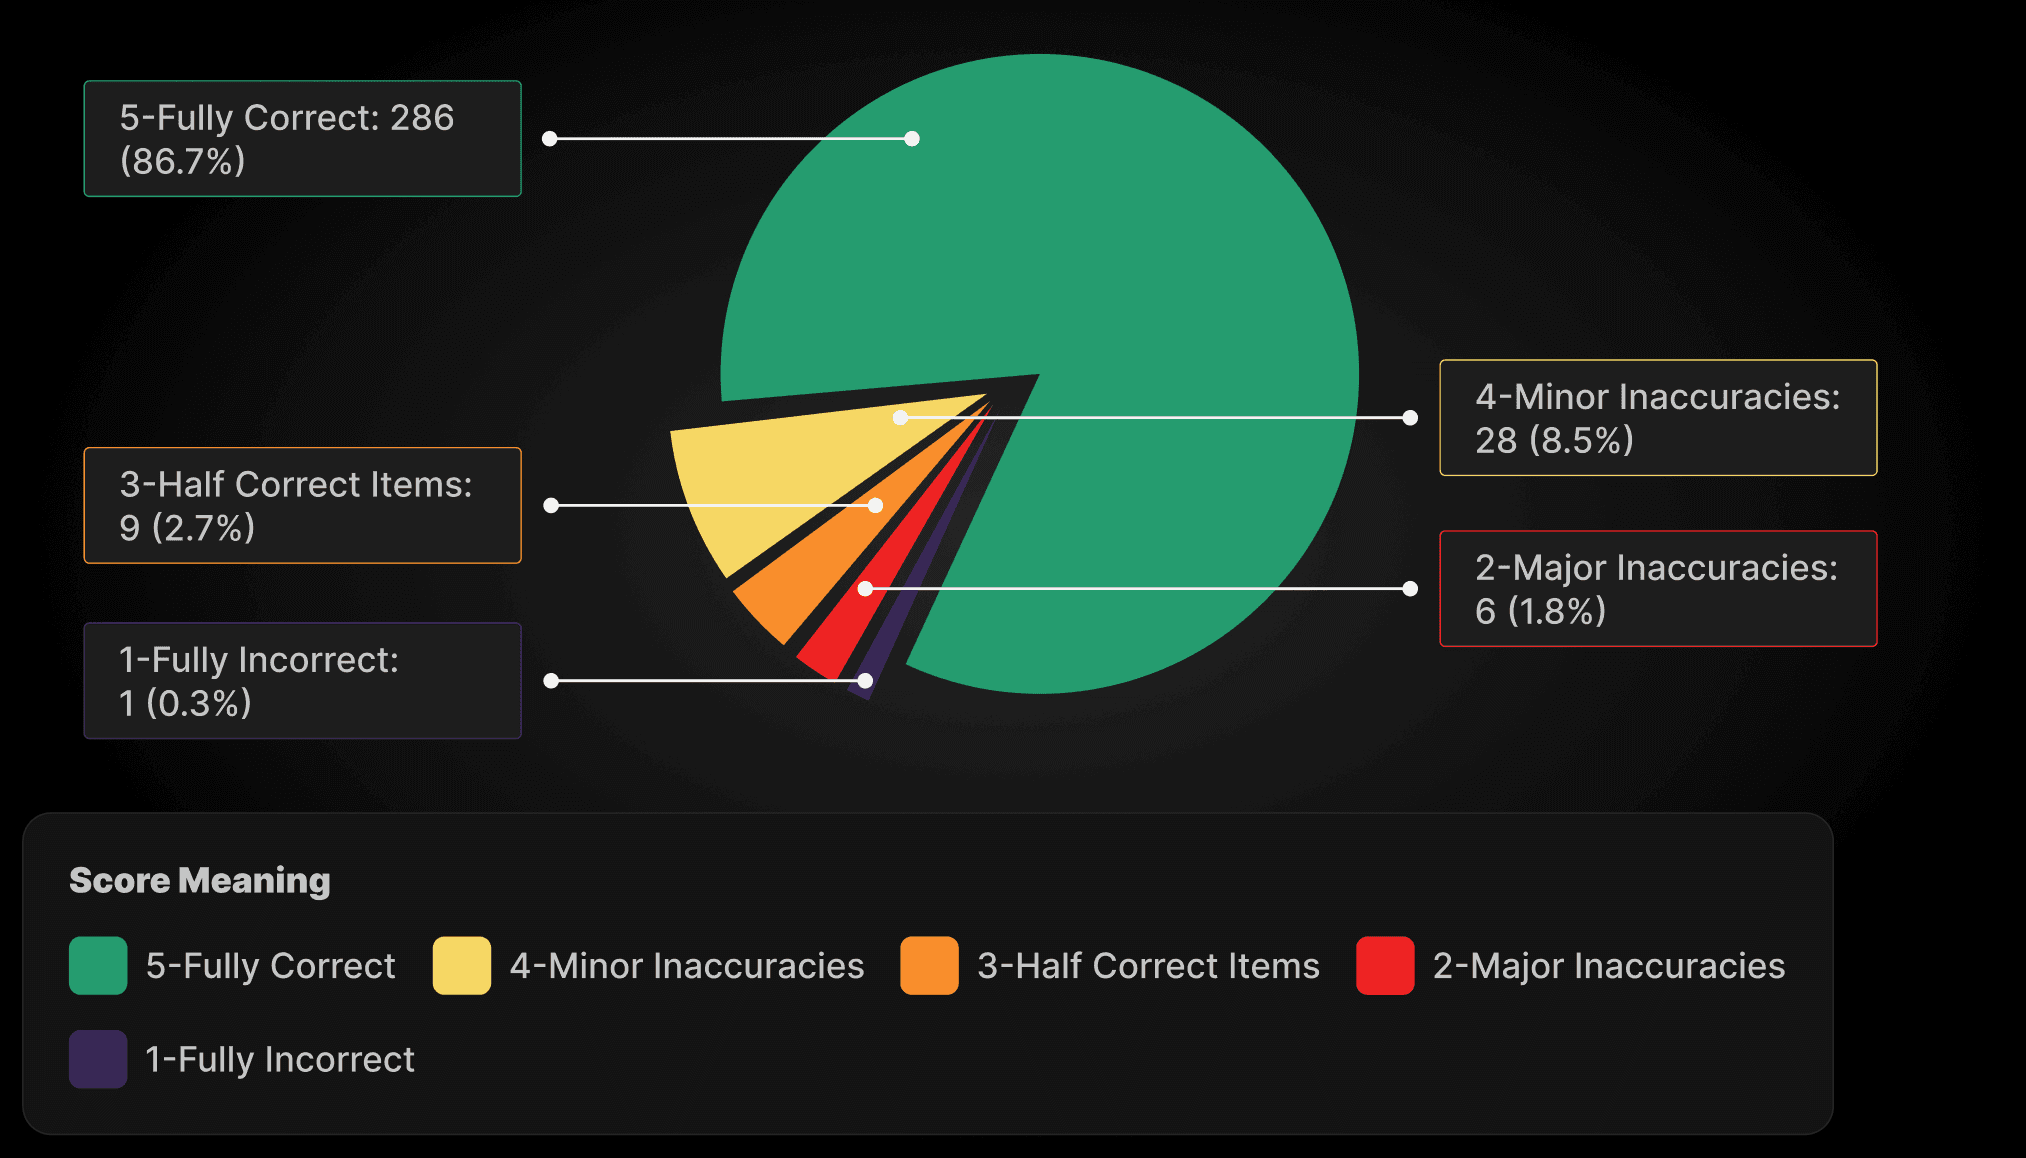
Correctness Score:
Correctness Score-Meaning | Count (Percentage) |
|---|---|
5-Fully Correct | 306 (92.7%) |
4-Minor Inaccuracies | 6 (1.8%) |
3-Half Correct Items | 2 (0.6%) |
2-Major Inaccuracies | 2 (0.6%) |
1-Fully Incorrect | 14 (4.2%) |
Total | 330 (100%) |
Statistical Summary | Value |
|---|---|
Count | 330 |
Mean | 4.78 |
Median | 5 |
Std Dev | 0.85 |
Min | 1 |
Max | 5 |
Mode | 5 (appeared 306 times) |
Correctness Score Distribution for 330 Reports | |
|---|---|
 |
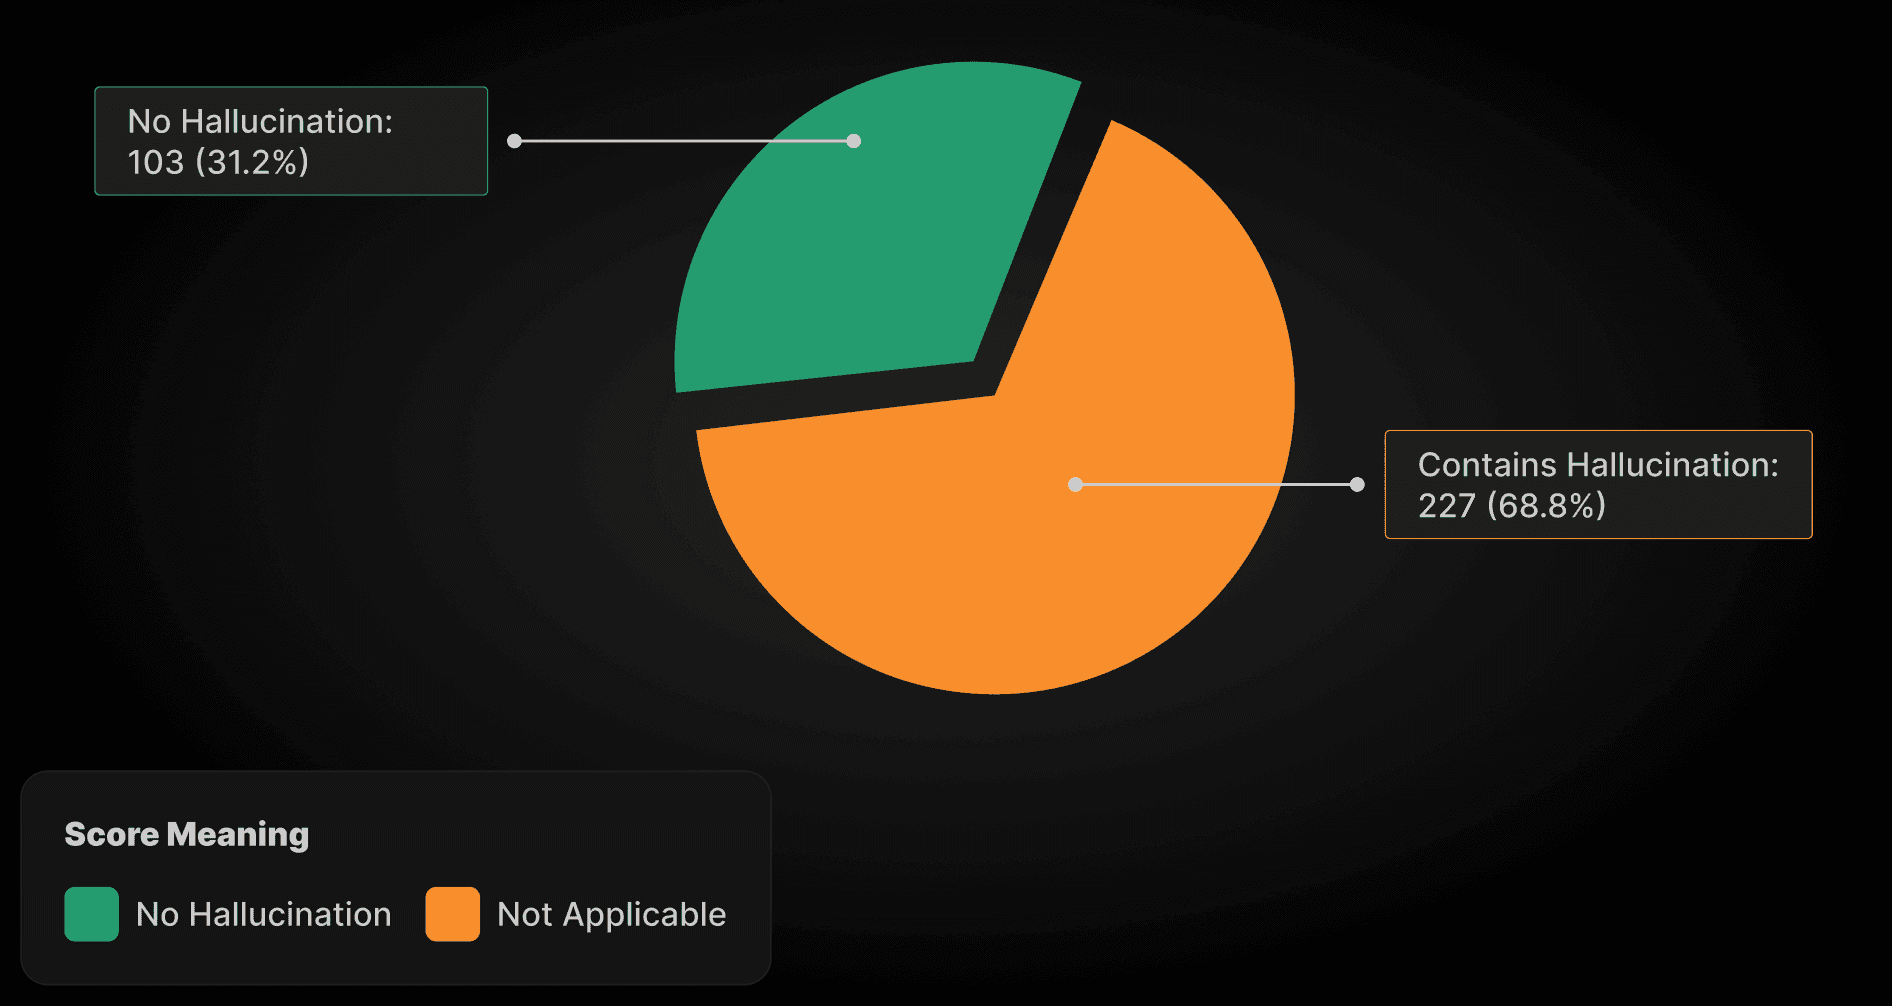
Hallucination Score: | |
|---|---|
Correctness Score-Meaning | Count (Percentage) |
No Hallucination | 103 (31.2%) |
Not Applicable | 227 (68.8%) |
Contains Hallucination | 0 (0.0%) |
Hallucination Score Distribution for 330 Reports | |
|---|---|
 |